Battery Thermal Barrier Market Analysis and Outlook Report: Industry Size, Share, Growth Trends, and Forecast (2025-2034)

Published On: May, 2025
|
Pages: 151

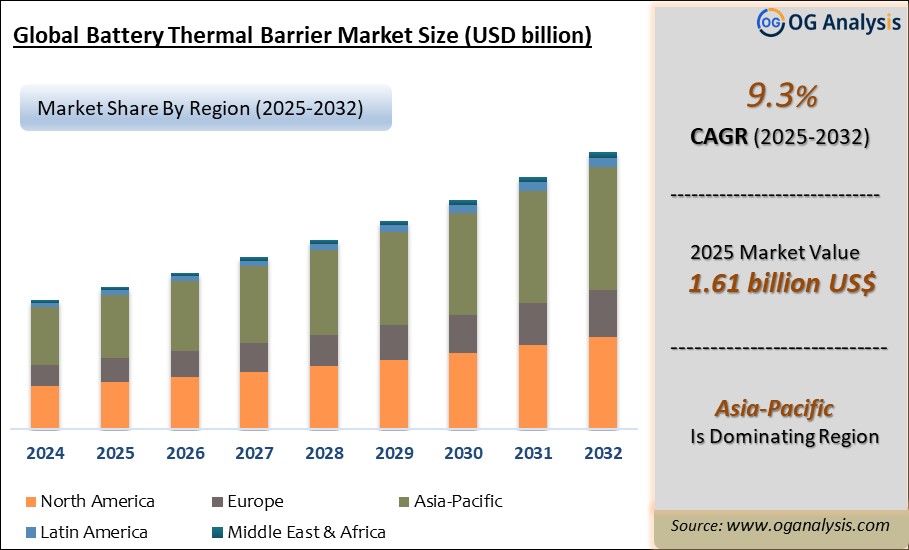
"The Global Battery Thermal Barrier Market Size is valued at USD 1.61 Billion in 2025. Worldwide sales of Battery Thermal Barrier Market are expected to grow at a significant CAGR of 9.3%, reaching USD 3.01 Billion by the end of the forecast period in 2032."

The battery thermal barrier market plays a crucial role in enhancing the safety and efficiency of energy storage systems, particularly in electric vehicles (EVs) and renewable energy applications. Battery thermal barriers are specially designed materials or structures that mitigate the risks of thermal runaway, a phenomenon where a cell’s temperature rapidly increases and can trigger a chain reaction in neighboring cells. By containing heat and preventing it from spreading, these barriers ensure greater stability, prolong battery life, and improve overall performance. With the accelerating adoption of EVs and the increasing reliance on energy storage solutions for renewable sources, manufacturers have focused on developing advanced thermal barriers that combine lightweight, durable, and cost-effective properties. As a result, the market has witnessed significant innovation, creating opportunities for both established players and emerging startups.

The market is driven by the need to meet stringent safety standards, address consumer concerns over battery reliability, and support advancements in battery chemistries. Battery thermal barriers are now more than just safety components; they are integral to enabling high-energy-density batteries that can sustain long ranges and fast-charging capabilities. From traditional materials like ceramic composites to next-generation aerogels and phase-change materials, the spectrum of available solutions is expanding rapidly. This innovation is complemented by growing collaboration among automotive OEMs, battery manufacturers, and material science companies. With the increasing push toward sustainable transportation and renewable energy, battery thermal barriers are set to remain a critical component of the evolving energy storage ecosystem.

Asia Pacific is the leading region in the battery thermal barrier market, propelled by the rapid expansion of electric vehicle production, strong government incentives for battery safety, and the growing presence of lithium-ion battery manufacturers. The passenger EV segment is the dominating segment in the market, fueled by rising consumer demand, advancements in battery technology, and stringent thermal management safety standards.

Global Battery Thermal Barrier Market Analysis 2025-2032: Industry Size, Share, Growth Trends, Competition and Forecast Report

Battery Thermal Barrier Market Key Takeaways

  • Battery thermal barriers prevent thermal runaway and enhance battery safety and longevity.
  • Advanced materials like aerogels and phase-change solutions offer higher efficiency and reduced weight.
  • Growing EV adoption drives demand for thermal barriers that support long-range and fast-charging batteries.
  • Collaboration among automakers, battery producers, and material companies accelerates innovation in thermal barrier technologies.
  • Regulatory pressure to improve battery safety standards encourages the use of advanced thermal management solutions.
  • Increased renewable energy storage applications create new opportunities for battery thermal barriers.
  • Battery manufacturers are prioritizing thermal management systems to improve performance and consumer confidence.
  • Next-generation batteries with higher energy densities require more efficient and durable thermal barriers.
  • Regional markets with aggressive EV adoption targets, such as China and the European Union, are at the forefront of thermal barrier technology integration.
  • Sustainability trends are pushing for the development of recyclable and eco-friendly thermal barrier materials.
  • R&D investments focus on creating cost-effective, lightweight, and scalable solutions for large-scale battery production.
  • Thermal barriers enhance overall vehicle safety, making them a critical factor in EV development strategies.
  • Customizable barrier solutions allow manufacturers to address different cell chemistries and module designs.
  • Emerging startups are challenging traditional players with innovative approaches to thermal barrier materials.
  • Future advancements may integrate intelligent thermal management systems, combining sensors with barrier materials.

Market Scope

Parameter

Detail

Base Year

2024

Estimated Year

2025

Forecast Period

2026-2032

Market Size-Units

USD billion

Market Splits Covered

By Product Type, By Application, By End User, By Technology, By Distribution Channel

Countries Covered

North America (USA, Canada, Mexico)
Europe (Germany, UK, France, Spain, Italy, Rest of Europe)
Asia-Pacific (China, India, Japan, Australia, Rest of APAC)
The Middle East and Africa (Middle East, Africa)
South and Central America (Brazil, Argentina, Rest of SCA)

Analysis Covered

Latest Trends, Driving Factors, Challenges, Trade Analysis, Price Analysis, Supply-Chain Analysis, Competitive Landscape, Company Strategies

Customization

10% free customization (up to 10 analyst hours) to modify segments, geographies, and companies analyzed

Post-Sale Support

4 analyst hours, available up to 4 weeks

Delivery Format

The Latest Updated PDF and Excel Data file

Battery Thermal Barrier Market Segmentation

By Product

  • Foam
  • Coatings
  • Fabrics

By Application

  • Electric Vehicles
  • Consumer Electronics
  • Renewable Energy Storage

By End User

  • Automotive
  • Aerospace
  • Electronics

By Technology

  • Passive
  • Active

By Distribution Channel

  • Online
  • Offline

By Geography

  • North America (USA, Canada, Mexico)
  • Europe (Germany, UK, France, Spain, Italy, Rest of Europe)
  • Asia-Pacific (China, India, Japan, Australia, Vietnam, Rest of APAC)
  • The Middle East and Africa (Middle East, Africa)
  • South and Central America (Brazil, Argentina, Rest of SCA)

Top 15 Companies Operating in the Battery Thermal Barrier Market

  • 3M Company
  • Asahi Kasei Corporation
  • BASF SE
  • Covestro AG
  • DuPont
  • Evonik Industries AG
  • Henkel AG & Co. KGaA
  • Kaneka Corporation
  • LG Chem
  • Saint-Gobain Performance Plastics
  • Solvay S.A.
  • Sika AG
  • Sumitomo Chemical Company, Limited
  • Thermo Fisher Scientific Inc.
  • Toray Industries, Inc.


1. Table of Contents
1.1 List of Tables
1.2 List of Figures

2. Battery Thermal Barrier Market Latest Trends, Drivers and Challenges, 2025- 2032
2.1 Battery Thermal Barrier Market Overview
2.2 Market Strategies of Leading Battery Thermal Barrier Companies
2.3 Battery Thermal Barrier Market Insights, 2025- 2032
2.3.1 Leading Battery Thermal Barrier Types, 2025- 2032
2.3.2 Leading Battery Thermal Barrier End-User industries, 2025- 2032
2.3.3 Fast-Growing countries for Battery Thermal Barrier sales, 2025- 2032
2.4 Battery Thermal Barrier Market Drivers and Restraints
2.4.1 Battery Thermal Barrier Demand Drivers to 2032
2.4.2 Battery Thermal Barrier Challenges to 2032
2.5 Battery Thermal Barrier Market- Five Forces Analysis
2.5.1 Battery Thermal Barrier Industry Attractiveness Index, 2024
2.5.2 Threat of New Entrants
2.5.3 Bargaining Power of Suppliers
2.5.4 Bargaining Power of Buyers
2.5.5 Intensity of Competitive Rivalry
2.5.6 Threat of Substitutes

3. Global Battery Thermal Barrier Market Value, Market Share, and Forecast to 2032
3.1 Global Battery Thermal Barrier Market Overview, 2024
3.2 Global Battery Thermal Barrier Market Revenue and Forecast, 2025- 2032 (US$ Billion)

3.3 Global Battery Thermal Barrier Market Size and Share Outlook By Product Type, 2025- 2032


3.4 Global Battery Thermal Barrier Market Size and Share Outlook By Application, 2025- 2032


3.5 Global Battery Thermal Barrier Market Size and Share Outlook By Technology, 2025- 2032


3.6 Global Battery Thermal Barrier Market Size and Share Outlook By End User, 2025- 2032

3.7 Global Battery Thermal Barrier Market Size and Share Outlook By By Distribution Channel, 2025- 2032

3.8 Global Battery Thermal Barrier Market Size and Share Outlook by Region, 2025- 2032

4. Asia Pacific Battery Thermal Barrier Market Value, Market Share and Forecast to 2032
4.1 Asia Pacific Battery Thermal Barrier Market Overview, 2024
4.2 Asia Pacific Battery Thermal Barrier Market Revenue and Forecast, 2025- 2032 (US$ Billion)
4.3 Asia Pacific Battery Thermal Barrier Market Size and Share Outlook By Product Type, 2025- 2032
4.4 Asia Pacific Battery Thermal Barrier Market Size and Share Outlook By Application, 2025- 2032
4.5 Asia Pacific Battery Thermal Barrier Market Size and Share Outlook By Technology, 2025- 2032
4.6 Asia Pacific Battery Thermal Barrier Market Size and Share Outlook By End User, 2025- 2032
4.7 Asia Pacific Battery Thermal Barrier Market Size and Share Outlook by Country, 2025- 2032
4.8 Key Companies in Asia Pacific Battery Thermal Barrier Market

5. Europe Battery Thermal Barrier Market Value, Market Share, and Forecast to 2032
5.1 Europe Battery Thermal Barrier Market Overview, 2024
5.2 Europe Battery Thermal Barrier Market Revenue and Forecast, 2025- 2032 (US$ Billion)
5.3 Europe Battery Thermal Barrier Market Size and Share Outlook By Product Type, 2025- 2032
5.4 Europe Battery Thermal Barrier Market Size and Share Outlook By Application, 2025- 2032
5.5 Europe Battery Thermal Barrier Market Size and Share Outlook By Technology, 2025- 2032
5.6 Europe Battery Thermal Barrier Market Size and Share Outlook By End User, 2025- 2032
5.7 Europe Battery Thermal Barrier Market Size and Share Outlook by Country, 2025- 2032
5.8 Key Companies in Europe Battery Thermal Barrier Market

6. North America Battery Thermal Barrier Market Value, Market Share and Forecast to 2032
6.1 North America Battery Thermal Barrier Market Overview, 2024
6.2 North America Battery Thermal Barrier Market Revenue and Forecast, 2025- 2032 (US$ Billion)
6.3 North America Battery Thermal Barrier Market Size and Share Outlook By Product Type, 2025- 2032
6.4 North America Battery Thermal Barrier Market Size and Share Outlook By Application, 2025- 2032
6.5 North America Battery Thermal Barrier Market Size and Share Outlook By Technology, 2025- 2032
6.6 North America Battery Thermal Barrier Market Size and Share Outlook By End User, 2025- 2032
6.7 North America Battery Thermal Barrier Market Size and Share Outlook by Country, 2025- 2032
6.8 Key Companies in North America Battery Thermal Barrier Market

7. South and Central America Battery Thermal Barrier Market Value, Market Share and Forecast to 2032
7.1 South and Central America Battery Thermal Barrier Market Overview, 2024
7.2 South and Central America Battery Thermal Barrier Market Revenue and Forecast, 2025- 2032 (US$ Billion)
7.3 South and Central America Battery Thermal Barrier Market Size and Share Outlook By Product Type, 2025- 2032
7.4 South and Central America Battery Thermal Barrier Market Size and Share Outlook By Application, 2025- 2032
7.5 South and Central America Battery Thermal Barrier Market Size and Share Outlook By Technology, 2025- 2032
7.6 South and Central America Battery Thermal Barrier Market Size and Share Outlook By End User, 2025- 2032
7.7 South and Central America Battery Thermal Barrier Market Size and Share Outlook by Country, 2025- 2032
7.8 Key Companies in South and Central America Battery Thermal Barrier Market

8. Middle East Africa Battery Thermal Barrier Market Value, Market Share and Forecast to 2032
8.1 Middle East Africa Battery Thermal Barrier Market Overview, 2024
8.2 Middle East and Africa Battery Thermal Barrier Market Revenue and Forecast, 2025- 2032 (US$ Billion)
8.3 Middle East Africa Battery Thermal Barrier Market Size and Share Outlook By Product Type, 2025- 2032
8.4 Middle East Africa Battery Thermal Barrier Market Size and Share Outlook By Application, 2025- 2032
8.5 Middle East Africa Battery Thermal Barrier Market Size and Share Outlook By Technology, 2025- 2032
8.6 Middle East Africa Battery Thermal Barrier Market Size and Share Outlook By End User, 2025- 2032
8.7 Middle East Africa Battery Thermal Barrier Market Size and Share Outlook by Country, 2025- 2032
8.8 Key Companies in Middle East Africa Battery Thermal Barrier Market

9. Battery Thermal Barrier Market Structure
9.1 Key Players
9.2 Battery Thermal Barrier Companies - Key Strategies and Financial Analysis
9.2.1 Snapshot
9.2.3 Business Description
9.2.4 Products and Services
9.2.5 Financial Analysis

10. Battery Thermal Barrier Industry Recent Developments

11 Appendix
11.1 Publisher Expertise
11.2 Research Methodology
11.3 Annual Subscription Plans
11.4 Contact Information


Get Free Sample

At OG Analysis, we understand the importance of informed decision-making in today's dynamic business landscape. To help you experience the depth and quality of our market research reports, we offer complimentary samples tailored to your specific needs.

Start Now! Please fill the form below for your free sample.

Why Request a Free Sample?

Evaluate Our Expertise: Our reports are crafted by industry experts and seasoned analysts. Requesting a sample allows you to assess the depth of research and the caliber of insights we provide.

Tailored to Your Needs: Let us know your industry, market segment, or specific topic of interest. Our free samples are customized to ensure relevance to your business objectives.

Witness Actionable Insights: See firsthand how our reports go beyond data, offering actionable insights and strategic recommendations that can drive your business forward.

Embark on your journey towards strategic decision-making by requesting a free sample from OG Analysis. Experience the caliber of insights that can transform the way you approach your business challenges.

You can purchase individual sections of this report. Explore pricing options for specific sections.

FAQ's

The Battery Thermal Barrier Market is estimated to reach USD 3.01 Billion by 2032.

The Global Battery Thermal Barrier Market is expected to grow at a Compound Annual Growth Rate (CAGR) of 9.3% during the forecast period from 2025 to 2032.

The Global Battery Thermal Barrier Market is estimated to generate USD 1.61 Billion in revenue in 2025.

License

$3950- 5%

$6450- 10%

$8450- 15%

Didn’t find what you’re looking for? TALK TO OUR ANALYST TEAM

Need something within your budget? NO WORRIES! WE GOT YOU COVERED!

Related Products

Ground Calcium Carbonate Market Outlook Report

Ground Calcium Carbonate Market Overview Ground calcium carbonate commonly referred to as GCC is finely ground limestone or marble, a calcium carbonate material having the chemical formula, CaCO3. GCC accounts for more than 80% of the Calcium carbonate market that is available in Ground Calcium Carbonate (GCC) and Precipitated Calcium Carbonate (PCC) forms. GCC is produced by mechanical grinding of the raw material, limestone, and then classified to the desired size without involving any chemical change in the process. In a magnified view, the distribution of particle sizes in a GCC is much broader than for a PCC of the same size, implying that there are many more large particles and many more small particles than in a PCC. The size of the largest of the particles (the ""top size"") is much greater for a GCC than for a PCC, thus making GCC a less refined version of Calcium carbonate. GCC is widely used as an industrial mineral is differentiated by three primary attributes - particle size, color and chemical purity. The mineral finds application in various industries based on its quality and suitability of use. Latest Trends in Ground Calcium Carbonate Market Growing Usage of Calcium Carbonate as Industrial Filler: Industrial filler has been the top and continuously growing application for calcium carbonate. Finely ground calcium carbonate is used as a filler in plastics, paints, and paper to improve aesthetics, and functionality and to save on filling costs. Calcium carbonate consumption as the filler has the potential to exceed calcium carbonate used as a dimension stone, in a few key markets. The most abundant sources of carbonate mineral fillers are the reserves of white marble. The most important attributes of carbonate fillers that decide their usefulness in industrial applications are particle size, brightness (whiteness), and chemical purity. Fillers were earlier used to substitute costlier materials in paint or polymers in rubbers or plastics. Currently, they are being used to add stiffness, color, opacity, or other required qualities to a product. Innovative technologies allowing the usage of GCC in new applications without altering the originality and functionality are aiding further penetration of GCC. Driving Factors Increase in Demand from the Construction and Infrastructure Sector: Robust development in construction and infrastructure activities across the world is generating demand for paints, coatings, adhesives, ceramics and various other polymers and concretes. These end-users are further deriving demand for ground calcium carbonate materials. Increasing Population, growing urbanization and fast-developing economies, especially in Asia and the Middle East, have led to growth in the need for infrastructure. Huge developments in infra projects and high-rise apartments necessitate lightweight and cost-effective options. Ground Calcium Carbonate is evolving robustly to match those requirements precisely. Market Challenges Environmental hazards of limestone mining: Limestone mining can disturb groundwater conditions. Limestone deposits frequently arise in association with karst, a landscape where limestone gradually dissolves underground. The deposits result in caves, sinkholes, and areas of rock ruptures that create underground drainage areas. Mining in karst can disturb natural aquifers and alter the flow of the underground water. Excavating operations often remove ground water to expose the mining site; this can decrease the level of the water table and alter water flows through rock formations. Streams and rivers can be changed when mines pump excess water from a limestone quarry into natural downstream channels. This increases the danger of flooding and any pollutants or alterations in water quality disturb the surface water. Companies Mentioned J.M. Huber Corporation Mississippi Lime Company Imerys Omya AG Minerals Technologies Inc. Mississippi Lime Company Carmeuse Shiraishi Kogyo Kaisha, Ltd. Maruo Calcium Co. Ltd. Okutama Kogyo Co., Ltd. Newpark Resources, Inc. *The companies above are listed in no particular order. Report Scope Details Market Value- $ Million,2024 22,357 Market Growth (Value), (2024-2031)- % 5.83 Leading Region Xx Base Year 2023 Forecast Period 2024 to 2031 Segments Covered By Form, By End Use Geography Covered North America, Europe, Asia-Pacific, South and Central America, and Middle East & Africa

Published:Feb-2025

Global Industrial Rubber Market Outlook Report: Latest Trends and Growth Opportunities by Region

The Industrial Rubber Market plays a critical role across various sectors, providing essential materials for manufacturing components used in automotive, construction, aerospace, and industrial applications. Industrial rubber is known for its flexibility, durability, and resistance to heat, chemicals, and abrasion, making it indispensable for producing tires, gaskets, seals, hoses, and belts. This market is broadly classified into two types: natural rubber and synthetic rubber, with synthetic rubber leading the market due to its customizable properties and cost-effectiveness. The rise in industrial activities, coupled with the demand for high-performance rubber products, is driving market growth globally. The market is witnessing robust expansion across key sectors, such as automotive and construction, where rubber components are essential for safety, durability, and functionality. Moreover, industrial rubber„¢s application in producing conveyor belts, anti-vibration mounts, and industrial hoses highlights its versatility. Rapid industrialization in emerging economies, particularly in Asia-Pacific, is contributing to the market's expansion. This growth is also supported by advancements in synthetic rubber technologies, which have enhanced the material„¢s performance under extreme conditions. With industries increasingly demanding rubber products that can withstand higher stress and harsh environments, the industrial rubber market is poised for steady growth over the next decade. Latest Trends One of the most significant trends shaping the Industrial Rubber Market is the shift towards eco-friendly and sustainable rubber products. With increasing environmental concerns, manufacturers are investing in developing bio-based rubber and materials with lower carbon footprints. For instance, innovations in natural rubber production, which focus on reducing deforestation and improving the sustainability of rubber plantations, are gaining momentum. In addition, the development of high-performance synthetic rubbers with improved thermal and chemical resistance is enabling their use in more demanding applications. Another emerging trend is the growing integration of advanced rubber technologies in the automotive sector. With the rise of electric vehicles (EVs), the demand for specialized rubber components that can withstand the unique requirements of EVs, such as low rolling resistance tires, is on the rise. The construction industry is also adopting new rubber materials for insulation, sealing, and vibration damping. Moreover, the use of recycled rubber, particularly in sectors such as construction and consumer goods, is gaining traction as industries focus on reducing waste and promoting circular economy practices. Market Drivers The increasing demand for industrial rubber in the automotive sector is one of the key drivers of market growth. Rubber is a vital component in tire manufacturing, which constitutes a significant portion of the industrial rubber market. As the automotive industry continues to evolve, with electric vehicles and hybrid cars gaining prominence, the need for durable, high-performance rubber parts is intensifying. Furthermore, rapid industrialization in emerging economies like China and India is creating a robust demand for industrial rubber, particularly in heavy machinery, construction, and manufacturing industries. The growth in construction activities, particularly in infrastructure development, is another major driver for the industrial rubber market. Rubber materials are extensively used in various construction applications such as flooring, roofing, insulation, and vibration dampening. Additionally, the increased demand for advanced industrial equipment in sectors such as oil & gas, mining, and aerospace is fueling the adoption of specialized rubber products, such as hoses, seals, and gaskets, to improve operational efficiency and safety. The growing focus on safety standards and durability further encourages industries to invest in high-quality rubber components. Market Challenges Despite its growth potential, the Industrial Rubber Market faces several challenges. Fluctuating raw material prices, particularly in the synthetic rubber segment, pose a significant challenge for manufacturers. Since synthetic rubber is derived from petrochemicals, any volatility in crude oil prices directly impacts production costs, which can lead to pricing pressures. Additionally, the growing regulatory pressures related to environmental sustainability and emission standards are pushing manufacturers to innovate and develop greener alternatives, which can be expensive and resource-intensive. Another challenge is the rising competition from alternative materials such as thermoplastics, which are being increasingly used in applications traditionally dominated by rubber. These materials offer certain advantages such as lower weight and recyclability, putting pressure on rubber manufacturers to innovate and maintain their market share. The need for constant technological advancements, coupled with high capital investments required for research and development, also presents hurdles for market players, particularly smaller companies.Market Players 1. Bridgestone Corporation2. Goodyear Tire & Rubber Company3. Michelin Group4. Continental AG5. Sumitomo Rubber Industries6. Yokohama Rubber Co., Ltd.7. Pirelli & C. S.p.A.8. Cooper Tire & Rubber Company9. Hankook Tire & Technology Group10. Lanxess AG11. Trelleborg AB12. Firestone Polymers13. JSR Corporation14. ExxonMobil Chemical15. Kumho Tire Co., Inc.

Published:Feb-2025

Hydrogen Sulfide Scavengers Market Analysis and Outlook Report: Industry Size, Share, Growth Trends, and Forecast (2025-2032)

The Hydrogen Sulfide (H?S) Scavengers market is experiencing steady growth, driven by increased demand across various industries, particularly oil and gas, petrochemicals, and wastewater treatment. These scavengers are essential for removing or neutralizing H?S, a toxic and corrosive gas, to ensure operational safety, protect equipment, and comply with environmental regulations. The market has witnessed notable advancements, including the development of more efficient and environmentally friendly H?S scavenging technologies. For instance, companies are introducing new chemistries that offer improved performance with reduced environmental impact. Additionally, strategic partnerships and acquisitions among key players are enhancing product portfolios and expanding market reach. North America is the leading region in the Hydrogen Sulfide Scavengers Market, fueled by stringent environmental regulations, extensive oil and gas exploration activities, and advanced industrial infrastructure. The liquid scavengers segment is the dominating product category, propelled by its higher efficiency and growing demand from upstream oil and gas operations seeking effective sour gas management solutions. Hydrogen Sulfide ScavengersMarket- Trends and Drivers,challenges The hydrogen sulfide (H₂S) scavengers market is experiencing steady growth, driven by increasing demand across various industries. The global market size was estimated at approximately USD 0.88 billion in 2025 and is projected to reach USD 2.46 billion by 2034, reflecting a compound annual growth rate (CAGR) of around 12.07% during the forecast period . Key drivers of this growth include the rising need for H₂S removal in the oil and gas sector, where hydrogen sulfide poses significant health and safety risks. The expansion of oil and gas exploration activities, particularly in sour gas fields, has amplified the demand for effective scavenging solutions . Additionally, stringent environmental regulations and growing awareness of the harmful effects of hydrogen sulfide are compelling industries to adopt efficient scavenging technologies . However, the market faces challenges such as the high cost of hydrogen sulfide scavengers, which can be a significant barrier for widespread adoption, especially among smaller companies . Performance limitations in extreme conditions and supply chain disruptions also pose challenges to market growth . Opportunities lie in the development of eco-friendly and more efficient scavengers. Innovations in scavenger formulations, including the creation of biodegradable and non-toxic agents, are gaining traction due to increased environmental awareness and regulatory pressures . The adoption of advanced scavenging systems, such as continuous chemical injection systems, is also a notable trend, offering automated and optimized H₂S removal Regionally, North America holds the largest market share, driven by stringent environmental regulations and a robust oil and gas industry . The Asia Pacific region is witnessing rapid growth due to industrialization and increasing energy demand in countries like China and India. Market Scope Parameter Detail Base Year 2024 Estimated Year 2025 Forecast Period 2026-2032 Market Size-Units USD billion Market Splits Covered By Product type, By End-User, By Physical Form, By Scavenger Chemistry Countries Covered North America (USA, Canada, Mexico) Europe (Germany, UK, France, Spain, Italy, Rest of Europe) Asia-Pacific (China, India, Japan, Australia, Rest of APAC) The Middle East and Africa (Middle East, Africa) South and Central America (Brazil, Argentina, Rest of SCA) Analysis Covered Latest Trends, Driving Factors, Challenges, Trade Analysis, Price Analysis, Supply-Chain Analysis, Competitive Landscape, Company Strategies Customization 10% free customization (up to 10 analyst hours) to modify segments, geographies, and companies analyzed Post-Sale Support 4 analyst hours, available up to 4 weeks Delivery Format The Latest Updated PDF and Excel Data file

Published:Apr-2025