Home Industry Reports Food And Beverages Non Alcoholic - Beverages Carbonated Beverage Processing Equipment Market

Carbonated Beverage Processing Equipment Market Analysis and Outlook Report: Industry Size, Share, Growth Trends, and Forecast (2026-2034)

Published On: Mar, 2026
|
Pages: 150+

"The Carbonated Beverage Processing Equipment Market was valued at $ 9.29 billion in 2025 and is projected to reach $ 21.55 billion by 2034, growing at a CAGR of 9.8%."

The carbonated beverage processing equipment market sits at the core of modern soft drinks, sparkling water, flavored carbonated drinks, energy beverages, mixers, and emerging “better-for-you” carbonated formulations. Equipment demand is primarily tied to beverage producers, contract packers, and brand owners expanding capacity or upgrading lines to improve hygiene, uptime, and packaging flexibility. Core process areas include water treatment and deaeration, syrup and ingredient handling, blending, carbonation systems, hygienic transfer, and downstream filling, capping/seaming, pasteurization or microbial control steps, labeling, and end-of-line packaging. Buyers increasingly evaluate solutions as an integrated line rather than isolated machines, prioritizing consistent carbonation accuracy, taste stability, fast changeovers, sanitation performance, and line efficiency across glass, cans, and plastic formats. Aftermarket support, availability of spares, operator training, and commissioning capability often weigh as heavily as equipment specifications, particularly where plants run high utilization and cannot afford unplanned stoppages.

Recent market momentum reflects a combination of product innovation and operational reinvention. Producers are leaning into modular and scalable line designs, higher automation, and digital tools that improve visibility into quality parameters such as dissolved gas control, blend precision, and in-line monitoring, while also reducing water, chemical, and energy intensity through smarter cleaning cycles and recovery practices. Packaging shifts toward cans, lightweight bottles, and multipack formats are pushing investments in flexible filling and packaging blocks, quicker format change parts, and better integration between process and packaging controls. Key drivers include expanding consumption of sparkling beverages, faster new-product launches that require agile manufacturing, stricter food safety expectations, and persistent labor constraints that favor automated, easier-to-run systems. Competition is led by global turnkey line suppliers and specialist process OEMs, alongside strong regional integrators; differentiation centers on hygienic design, throughput stability, lifecycle cost, service footprint, and controls/software that translate plant data into higher overall equipment effectiveness.

Key Market Insights

  • Packaging-led line investments (historic → current → future) The long-term shift from returnable glass toward PET and, more recently, cans has steadily reshaped equipment choices. Producers are prioritizing filler flexibility, faster format changeovers, and tighter integration between process and packaging. Future line designs increasingly favor “one line, many SKUs” capability. This reinforces demand for modular blocks and quick-change parts. End-of-line automation becomes a larger share of project scope.

  • Rise of sparkling water and flavored carbonation (current → future) Sparkling water growth and flavor innovation are driving more frequent recipe switches and shorter runs. This elevates the importance of precise blending, dosing, and carbonation control to maintain taste consistency. Equipment that supports rapid flavor change and minimal flavor carryover is gaining preference. Plants are adopting more hygienic, low-hold-up manifolds and smarter CIP sequencing. Applications expand beyond classic CSDs into premium and functional sparkling formats.

  • Carbonation accuracy and product stability as key differentiators Brands increasingly compete on mouthfeel, “bite,” and sensory consistency, pushing tighter control over CO₂ dissolution and temperature management. Deaeration performance, in-line measurement, and closed-loop control systems are becoming standard requirements. Future improvements focus on real-time quality monitoring and reduced variability across shifts. This benefits advanced carbonation skids, inline sensors, and more stable process control architectures. It also increases the value of OEM process know-how and commissioning expertise.

  • Hygienic design and food-safety expectations accelerating upgrades Over time, hygiene standards have moved from compliance to brand protection, influencing equipment materials, surface finishes, drainability, and validation. Today’s buyers emphasize sanitary construction, dead-leg minimization, and robust CIP coverage. Future regulatory and customer audits will further reward traceable, data-backed sanitation performance. This drives demand for hygienic valves, fittings, inline filtration, and validated cleaning systems. It also strengthens the aftermarket for audits, retrofits, and hygiene optimization.

  • Automation and digitalization shifting from optional to essential Historically, many plants relied on manual checks and operator experience; modern operations increasingly require automated control and dashboards. Current investments target OEE improvement, downtime reduction, and faster troubleshooting through connected sensors and analytics. Future systems will expand predictive maintenance, remote support, and recipe governance across multi-site networks. Integration between PLC/SCADA, MES, and quality systems becomes a differentiator. Cybersecurity and data integrity rise as key selection criteria.

  • Energy, water, and chemical efficiency reshaping total cost of ownership Operating efficiency has become a stronger decision factor as utilities and sustainability targets tighten. Producers are focusing on optimized CIP cycles, water reuse, heat recovery, and compressed-air management. Future projects will embed resource-efficiency metrics into line acceptance and KPI frameworks. Equipment suppliers that can guarantee repeatable cleaning outcomes with less resource use gain advantage. This especially influences water treatment, CIP skids, and utility-intensive packaging equipment.

  • Speed-to-market driving agile manufacturing and flexible asset design The market has evolved from stable, high-volume SKUs to frequent launches and limited editions. Current projects prioritize modular mixing systems, scalable syrup rooms, and faster changeovers to reduce time between product concepts and shelf-ready output. Future competitiveness depends on rapid commissioning, validated recipes, and minimal ramp-up losses. This supports compact, standardized platforms that can be replicated across plants. Co-packers benefit disproportionately due to multi-brand complexity.

  • Functional and “better-for-you” formulations complicating processing needs Reduced sugar, natural flavors, acid systems, and functional ingredients can increase sensitivity to shear, oxygen, or temperature. Equipment must handle diverse ingredients while protecting quality and minimizing foaming or flavor degradation. Going forward, more complex formulations will raise the importance of gentle handling, precise dosing, and robust inline monitoring. This boosts demand for high-accuracy metering, hygienic ingredient handling, and improved filtration. It also increases validation and change-control requirements.

  • Competitive landscape favoring full-line capability plus strong service networks Historically, local integrators competed on cost; today, global OEMs and top regional players win on turnkey execution, standardized platforms, and lifecycle support. Buyers increasingly prefer suppliers that can deliver end-to-end integration—process, filling, and packaging—with performance guarantees. Future competition will intensify around service responsiveness, spares availability, and remote diagnostics. The aftermarket (retrofits, upgrades, line audits) becomes a strategic battleground. Partnerships between process specialists and packaging OEMs continue to strengthen.

  • Regional investment patterns and localization of spares/services shaping vendor selection Mature markets often emphasize upgrades, efficiency, and automation, while emerging markets drive greenfield capacity and cost-optimized lines. Local compliance, utilities reliability, and workforce skill levels influence equipment robustness and automation depth. Future growth will favor vendors that localize service teams, training, and parts depots while maintaining global quality standards. This improves uptime and reduces commissioning risk for customers. It also encourages platform standardization with region-specific configurations.

Global carbonated soft drinks consumption volume, 2018–2024(billion litres)

Figure: Global carbonated soft drink consumption increased from about 200 billion litres in 2018 to more than 220 billion litres in 2024, indicating sustained throughput growth across carbonation, blending, filling and packaging lines. This rising CSD volume directly supports investments in high-speed processing equipment, including automated carbonation systems, advanced PET and can filling lines, and integrated quality-control solutions, shaping the long-term expansion of the carbonated beverage processing equipment market.
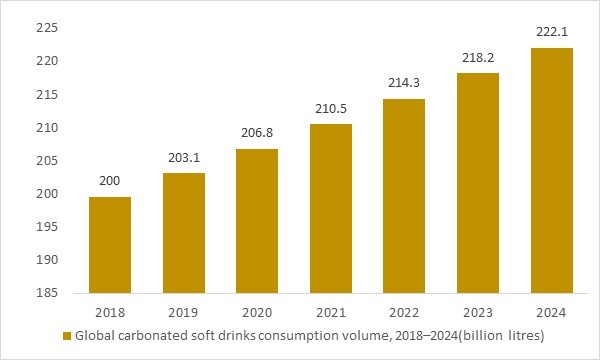
Global carbonated soft drink consumption 2018–2024 – OG Analysis chart driving carbonated beverage processing equipment demand.

  • Global demand for carbonated soft drinks has steadily increased from around 199.6 billion litres in 2018 to more than 218 billion litres in 2023, with volumes expected to exceed 222 billion litres in 2024. This sustained rise in production and consumption directly expands throughput requirements across carbonation, mixing, filling, capping and packaging lines. As beverage manufacturers introduce more low-sugar, flavoured and premium CSD variants, the need for flexible, high-speed and hygienic processing equipment grows further. These structural volume and SKU trends create a strong, long-term demand base for carbonated beverage processing equipment worldwide.

Regional Insights

North America

North America’s carbonated beverage processing equipment market is driven by strong consumption of soft drinks, sparkling water, energy drinks, and flavored carbonated beverages, alongside continuous product innovation by major beverage brands. Market dynamics emphasize high-speed production efficiency, hygiene compliance, automation, and flexibility to handle multiple SKUs and packaging formats. Manufacturers prioritize advanced carbonation systems, mixing and blending units, filtration equipment, pasteurization systems, and automated filling lines that ensure consistent taste and quality. Lucrative opportunities are strongest in plant modernization projects, craft and premium beverage startups, and health-oriented sparkling drink segments. Latest trends include integration of IoT-enabled monitoring systems, energy-efficient compressors, reduced water usage technologies, and modular equipment designs that enable rapid product changeovers. The outlook remains steady as demand for diversified carbonated offerings continues, with recent developments focused on digital production controls, predictive maintenance solutions, and sustainable processing technologies.

Asia Pacific

Asia Pacific represents the fastest-growing region due to rising urbanization, expanding middle-class consumption, and strong beverage manufacturing capacity. Market dynamics prioritize scalable production lines, cost optimization, and adaptability to regional flavor variations. Lucrative opportunities lie in new bottling plants, expansion of ready-to-drink carbonated beverages, and private-label production serving both domestic and export markets. Trends include increased adoption of fully automated processing lines, investment in compact carbonation systems for mid-sized manufacturers, and growing focus on hygiene and safety standards. The forecast remains robust as beverage consumption grows across emerging economies, with recent developments centered on capacity expansion, advanced mixing technologies, and partnerships between equipment suppliers and regional beverage producers.

Europe

Europe’s carbonated beverage processing equipment market is shaped by mature consumption patterns, strong regulatory standards, and growing demand for low-sugar and functional sparkling beverages. Market dynamics emphasize sustainability, energy efficiency, and compliance with food safety and environmental regulations. Lucrative opportunities are concentrated in plant upgrades to reduce carbon footprint, expansion of premium sparkling water brands, and equipment tailored for reduced sugar and natural ingredient formulations. Latest trends include development of low-energy carbonation systems, closed-loop water recycling solutions, and enhanced process automation for traceability. The outlook is steady and innovation-driven as beverage companies focus on product differentiation and operational efficiency, with recent developments centered on eco-friendly processing solutions, digital integration, and flexible manufacturing systems.

Middle East & Africa

Middle East & Africa demand is influenced by expanding urban populations, rising disposable incomes, and growth in hospitality and retail sectors. Market dynamics emphasize durability in high-temperature environments, water efficiency, and reliable high-capacity bottling systems. Lucrative opportunities are strongest in new beverage production facilities, regional expansion of multinational brands, and growth in flavored sparkling drinks tailored to local tastes. Trends include adoption of robust carbonation and filling technologies suited to harsh climates, increased investment in modern processing plants, and stronger distributor partnerships for equipment servicing. The outlook remains positive as consumer demand for carbonated beverages grows, with recent developments focused on plant automation, improved energy management systems, and localized equipment assembly.

South & Central America

South & Central America’s carbonated beverage processing equipment market is supported by strong regional beverage brands, expanding bottling operations, and increasing demand for soft drinks and sparkling beverages. Market dynamics highlight cost efficiency, reliability, and scalability to serve both domestic consumption and export markets. Lucrative opportunities exist in modernization of aging bottling lines, growth of private-label beverage production, and expansion into flavored and functional carbonated drinks. Latest trends include greater adoption of automated blending and carbonation systems, improved hygienic design standards, and investment in energy-efficient processing technologies. The outlook remains steadily positive as beverage production capacity expands, with recent developments centered on production optimization, improved quality control systems, and integration of digital monitoring across processing operations.

Market Scope

Parameter

Carbonated Beverage Processing Equipment Market Detail

Base Year

2024

Estimated Year

2025

Forecast Period

2026-2034

Market Size-Units

USD billion

Market Splits Covered

By Product Type, By Diagnostic Method, By End User

Countries Covered

North America (USA, Canada, Mexico)
Europe (Germany, UK, France, Spain, Italy, Rest of Europe)
Asia-Pacific (China, India, Japan, Australia, Rest of APAC)
The Middle East and Africa (Middle East, Africa)
South and Central America (Brazil, Argentina, Rest of SCA)

Analysis Covered

Latest Trends, Driving Factors, Challenges, Trade Analysis, Price Analysis, Supply-Chain Analysis, Competitive Landscape, Company Strategies

Customization

10% free customization (up to 10 analyst hours) to modify segments, geographies, and companies analyzed

Post-Sale Support

4 analyst hours, available up to 4 weeks

Delivery Format

The Latest Updated PDF and Excel Data file

Carbonated Beverage Processing Equipment Market Segments Covered In The Report


By Equipment Type
- Sugar Dissolvers
- Carbonation Equipment
- Blender And Mixers
- Heat Exchangers
- Silos
- Filtration Equipment

By Beverage Type
- Flavored Drinks
- Functional Drinks
- Club Soda And Sparkling Water

By Distribution Channel
- Original Equipment Manufacturer
- Aftermarket Sales

By Geography
- North America (USA, Canada, Mexico)
- Europe (Germany, UK, France, Spain, Italy, Rest of Europe)
- Asia-Pacific (China, India, Japan, Australia, Vietnam, Rest of APAC)
- The Middle East and Africa (Middle East, Africa)
- South and Central America (Brazil, Argentina, Rest of SCA)

Key Companies Covered

Tetra Laval International SA, GEA Group AG, Alfa Laval Group, Krones AG, SPX flow inc., KHS GmbH, A Due Di Squeri Donato & Cspa, Van Der Molen GmbH, Seppelec SL, TCP Pioneer Co. Ltd., A Water System srl, Pentair plc, Shreeji Projects, Roquette Frères, Mitsui Sugar Co.Ltd., Archer-Daniels-Midland Company, Tate & Lyle plc, Pyure Brands LLC, PureCircle, Ajinomoto Health & Nutrition North America Inc., Goma Engineering Pvt. Ltd., Tetra Pak International S.A., PepsiCo Inc., The Coca-Cola Company, Keurig Dr Pepper Inc., Britvic plc, National Beverage Corp., Parle Agro Private Limited, The Pepsi Bottling Group, The Dr. Pepper Snapple Group .

Recent Industry Developments

  • August 2025: Beverage industry veterans launched Pittston Co-Packers, a 403,000 sq.ft. contract manufacturing and packaging facility in Pennsylvania, designed to support large-scale production for carbonated beverages and ready-to-drink products.
  • February 2025: Equipment manufacturers introduced new-generation processing systems equipped with enhanced automation, smart monitoring features, and IoT integration to meet growing demand for diversified carbonated beverage formulations.
  • June 2024: Rotarex Solutions released the BubbleBox Carbo Pro, an advanced inline carbonation system targeting hospitality venues, offering consistent and scalable sparkling water production with minimal installation footprint.

What You Receive

• Global Carbonated Beverage Processing Equipment market size and growth projections (CAGR), 2024- 2034
• Impact of recent changes in geopolitical, economic, and trade policies on the demand and supply chain of Carbonated Beverage Processing Equipment.
• Carbonated Beverage Processing Equipment market size, share, and outlook across 5 regions and 27 countries, 2025- 2034.
• Carbonated Beverage Processing Equipment market size, CAGR, and Market Share of key products, applications, and end-user verticals, 2025- 2034.
• Short and long-term Carbonated Beverage Processing Equipment market trends, drivers, restraints, and opportunities.
• Porter’s Five Forces analysis, Technological developments in the Carbonated Beverage Processing Equipment market, Carbonated Beverage Processing Equipment supply chain analysis.
• Carbonated Beverage Processing Equipment trade analysis, Carbonated Beverage Processing Equipment market price analysis, Carbonated Beverage Processing Equipment Value Chain Analysis.
• Profiles of 5 leading companies in the industry- overview, key strategies, financials, and products.
• Latest Carbonated Beverage Processing Equipment market news and developments.

The Carbonated Beverage Processing Equipment Market international scenario is well established in the report with separate chapters on North America Carbonated Beverage Processing Equipment Market, Europe Carbonated Beverage Processing Equipment Market, Asia-Pacific Carbonated Beverage Processing Equipment Market, Middle East and Africa Carbonated Beverage Processing Equipment Market, and South and Central America Carbonated Beverage Processing Equipment Markets. These sections further fragment the regional Carbonated Beverage Processing Equipment market by type, application, end-user, and country.

You can purchase individual sections of this report. Explore pricing options for specific sections.

FAQ's

The Global Carbonated Beverage Processing Equipment Market is estimated to generate USD 9.29 billion in revenue in 2025.

The Global Carbonated Beverage Processing Equipment Market is expected to grow at a Compound Annual Growth Rate (CAGR) of 9.8% during the forecast period from 2025 to 2034.

The Carbonated Beverage Processing Equipment Market is estimated to reach USD 21.55 billion by 2034.

License

Didn’t find what you’re looking for? TALK TO OUR ANALYST TEAM

Need something within your budget? NO WORRIES! WE GOT YOU COVERED!

Related Products

Frozen Finger Chips Market Analysis and Outlook Report: Industry Size, Share, Growth Trends, and Forecast (2026-2034)

The Frozen Finger Chips Market comprises pre-cut, partially fried or blanched potato strips preserved through freezing for convenient preparation across foodservice and household applications. Demand is strongest from quick-service restaurants, hotels, cafés, institutional kitchens, cloud kitchens, catering companies, supermarkets, and households seeking consistent taste, texture, and preparation time. Straight-cut fries remain the most widely consumed format, while crinkle-cut, shoestring, steak-cut, coated, seasoned, and specialty variants are gaining attention. The market benefits from changing eating habits, growth in organized foodservice, increased consumption of convenience foods, and wider availability of frozen products through modern retail and online grocery channels. Recent market trends include demand for extra-crispy coatings, air-fryer-compatible products, clean-label formulations, reduced-oil options, and premium seasoned fries. Manufacturers are investing in processing automation, rapid freezing technologies, advanced potato varieties, improved packaging, and stronger cold-chain networks to maintain quality and reduce waste. Private-label products are expanding as retailers strengthen their frozen-food portfolios, while foodservice operators increasingly prefer standardized products that simplify kitchen operations. The competitive landscape includes multinational frozen-potato processors, regional manufacturers, agricultural cooperatives, and private-label suppliers competing on potato sourcing, product consistency, pricing, distribution reach, and customization. Growth opportunities remain strong in emerging economies where urbanization, restaurant expansion, and modern retail penetration are increasing. However, fluctuations in potato availability, energy and logistics costs, cold-storage limitations, health concerns related to fried foods, and intense price competition continue to influence market performance. Key Insights Straight-cut frozen finger chips remain the leading product type due to their widespread use across quick-service restaurants, hotels, cafés, institutional kitchens, and households. Their familiar shape, uniform cooking performance, and compatibility with frying, baking, and air frying support broad acceptance. Manufacturers continue to enhance crispness, color consistency, and holding time. Quick-service restaurants represent the dominant end-use segment as frozen finger chips are a core accompaniment to burgers, fried chicken, sandwiches, and other fast-food offerings. These products help restaurant chains maintain consistent taste, portion control, and preparation speed across outlets. Expansion of organized foodservice networks continues to strengthen institutional demand. Household consumption is expanding as consumers increasingly prefer convenient, ready-to-cook snacks and side dishes. Growing ownership of air fryers, microwave ovens, and home freezers is supporting at-home preparation. Smaller pack sizes, resealable packaging, and wider online grocery availability are improving consumer accessibility. Coated and seasoned finger chips are gaining traction due to their enhanced crispness, flavor differentiation, and ability to retain texture during takeaway and delivery. Foodservice operators increasingly prefer coated variants for longer holding periods. Spicy, cheese-flavored, herb-based, and regional seasoning profiles are supporting product innovation. Air-fryer-compatible and reduced-oil products are emerging as important growth categories amid increasing consumer focus on healthier cooking methods. Manufacturers are developing formulations that deliver crisp texture with limited oil usage. Clean-label ingredients, lower sodium content, and alternative cooking oils are also influencing new product development. Cold-chain infrastructure plays a critical role in determining product availability, shelf life, and geographic market penetration. Investment in refrigerated warehousing, transportation, and retail freezer networks is enabling suppliers to reach smaller cities and emerging markets. Inadequate cold-storage facilities remain a major barrier in underdeveloped regions. Potato variety, crop quality, and supply-chain management directly influence the taste, texture, color, and processing yield of frozen finger chips. Large manufacturers increasingly rely on contract farming, specialized potato varieties, and controlled storage systems. Weather variability, crop diseases, and raw-material price fluctuations continue to create sourcing risks. Competition is intensifying among multinational processors, regional manufacturers, private-label suppliers, and agricultural cooperatives. Leading companies compete through integrated sourcing, large-scale processing, reliable distribution, product customization, and foodservice partnerships. Regional players differentiate through local flavors, flexible packaging, and competitive pricing. Regional Analysis North America Frozen Finger Chips Market North America represents a mature market for frozen finger chips, supported by high consumption across quick-service restaurants, casual dining chains, institutional kitchens, and households. The United States leads regional demand due to its well-established fast-food culture, extensive frozen-food retail network, and strong presence of large potato processors. Growing preference for air-fryer-compatible products, seasoned variants, and premium coated fries is encouraging product innovation. Food delivery, cloud kitchens, and convenience-focused meal preparation also support demand. Competition remains intense, with multinational manufacturers, private-label suppliers, and regional processors focusing on product consistency, supply reliability, and foodservice partnerships. Europe Frozen Finger Chips Market Europe holds a prominent position in the frozen finger chips market due to strong potato-processing capabilities, developed cold-chain infrastructure, and widespread consumption of fries as a side dish and snack. The United Kingdom, Germany, France, Belgium, and the Netherlands are among the key regional markets. Demand is supported by quick-service restaurants, pubs, hotels, catering services, and household consumers. European manufacturers are increasingly focusing on clean-label formulations, sustainable sourcing, reduced-oil products, and recyclable packaging. Premium cuts, skin-on fries, and seasoned options are also gaining popularity, while private-label products maintain a strong presence across supermarkets and discount retailers. Asia-Pacific Frozen Finger Chips Market Asia-Pacific is experiencing rapid market development, driven by urbanization, rising disposable incomes, expansion of international fast-food chains, and increasing consumption of Western-style convenience foods. China, India, Japan, South Korea, Australia, and Southeast Asian countries represent important growth markets. Demand is increasing across quick-service restaurants, cafés, hotels, cloud kitchens, and modern retail outlets. Improvements in cold storage, refrigerated logistics, and online grocery delivery are expanding market accessibility. Local manufacturers are introducing affordable pack sizes and regional flavors, while international suppliers continue to invest in processing capacity, distribution partnerships, and contract farming arrangements. Middle East & Africa Frozen Finger Chips Market The Middle East & Africa market is expanding as organized foodservice, tourism, hospitality, and modern retail continue to develop. Saudi Arabia, the United Arab Emirates, South Africa, Egypt, and other urbanized markets account for a significant share of regional demand. Frozen finger chips are widely consumed through quick-service restaurants, hotels, catering services, and institutional food programs. Strong reliance on imported frozen potato products creates opportunities for international suppliers, although local processing initiatives are gradually emerging. Cold-chain limitations, import costs, and uneven retail infrastructure remain key challenges, particularly across less-developed African markets. South & Central America Frozen Finger Chips Market South & Central America represents a developing market supported by growing fast-food consumption, urban population expansion, and wider availability of frozen products through supermarkets and foodservice distributors. Brazil, Mexico, Argentina, Chile, and Colombia are among the major regional markets. Demand is driven by restaurant chains, food courts, hotels, convenience stores, and household consumers seeking easy-to-prepare snacks and side dishes. Regional manufacturers compete through locally sourced potatoes, competitive pricing, and customized flavors. However, economic volatility, cold-chain gaps, raw-material fluctuations, and dependence on imported processing equipment can affect market expansion. Report Scope Parameter Frozen Finger Chips Market Detail Base Year 2025 Estimated Year 2026 Forecast Period 2026-2034 Market Size-Units USD billion Market Splits Covered Flavor, Packaging Type, Distribution Channel, End Use Countries Covered North America (USA, Canada, Mexico) Europe (Germany, UK, France, Spain, Italy, Rest of Europe) Asia-Pacific (China, India, Japan, Australia, Rest of APAC) The Middle East and Africa (Middle East, Africa) South and Central America (Brazil, Argentina, Rest of SCA) Analysis Covered Latest Trends, Driving Factors, Challenges, Trade Analysis, Price Analysis, Supply-Chain Analysis, Competitive Landscape, Company Strategies Customization 10% free customization (up to 10 analyst hours) to modify segments, geographies, and companies analyzed Post-Sale Support 4 analyst hours, available up to 4 weeks Delivery Format The Latest Updated PDF and Excel Data file

Published:Jul-2026

Tortilla and Flatbread Market Analysis and Outlook Report: Industry Size, Share, Growth Trends, and Forecast (2026-2034)

The tortilla and flatbread market encompasses a diverse range of unleavened and lightly leavened bakery products consumed as staple foods, meal carriers, snacks, and convenient alternatives to conventional bread. Products such as corn and wheat tortillas, pita, naan, lavash, wraps, roti, and other regional flatbreads serve retail, foodservice, institutional, and industrial food-processing applications. Their versatility, portability, extended shelf-life potential, and compatibility with varied fillings and cuisines have strengthened their position across breakfast, lunch, snacking, and ready-meal occasions. Demand is being supported by urbanization, changing meal patterns, multicultural food adoption, and growing consumer preference for convenient products that combine familiarity with flexible preparation. Market development is increasingly shaped by clean-label formulations, whole-grain and high-fiber options, gluten-free variants, protein enrichment, reduced-sodium recipes, and premium artisanal offerings. Manufacturers are investing in automated production lines, improved dough-handling systems, modified-atmosphere packaging, and advanced preservation technologies to enhance consistency, freshness, and distribution reach. Competition remains fragmented, with multinational bakery groups, regional specialists, private-label suppliers, and ethnic food brands competing through product innovation, geographic expansion, foodservice partnerships, and portfolio diversification. Key challenges include volatility in wheat, corn, edible oil, and energy costs; maintaining texture and freshness without synthetic additives; and complying with labeling, food-safety, allergen, and nutritional regulations across markets. Trade flows, cold-chain requirements for selected products, retail consolidation, and efficient sourcing of grains and packaging materials remain central to profitability and supply reliability. Key Takeaways Convenience remains a major demand driver, as tortillas and flatbreads support quick meal preparation, portable consumption, and flexible menu development across retail and foodservice channels. Health-focused innovation is accelerating, with manufacturers introducing whole-grain, high-fiber, high-protein, gluten-free, reduced-sodium, and clean-label product variants. Foodservice demand is expanding through quick-service restaurants, cafés, institutional catering, and casual dining formats that use flatbreads in wraps, sandwiches, pizzas, and ethnic dishes. Premiumization is creating opportunities for artisanal products, authentic regional recipes, specialty grains, differentiated textures, and restaurant-inspired flavor profiles. Automation and advanced processing technologies are improving production efficiency, product consistency, throughput, weight control, and waste reduction across manufacturing facilities. Modified-atmosphere packaging, improved preservation systems, and formulation enhancements are helping producers extend shelf life while maintaining texture, softness, and freshness. Competitive intensity remains high, with multinational bakery groups, regional producers, ethnic food brands, private-label suppliers, and foodservice specialists expanding their portfolios. Raw material volatility, regulatory compliance, allergen management, food-safety requirements, and supply-chain disruption remain key challenges affecting margins and operational planning. Regional Analysis North America Tortilla and Flatbread Market North America remains a leading tortilla and flatbread market, supported by strong consumption of tortillas, wraps, pita bread, naan, and other convenient meal carriers across retail, foodservice, and institutional channels. Market dynamics are shaped by the popularity of Mexican and Mediterranean cuisines, demand for portable meals, and growing consumer preference for high-protein, low-carbohydrate, gluten-free, and clean-label products. Lucrative opportunities are strong in premium tortillas, functional flatbreads, frozen and refrigerated formats, and foodservice-oriented product development. The forecast remains favorable as manufacturers expand capacity and diversify product portfolios, while latest developments focus on better-for-you formulations, extended shelf-life technologies, recyclable packaging, and strategic partnerships with restaurant and retail chains. Asia Pacific Tortilla and Flatbread Market Asia Pacific is a rapidly expanding tortilla and flatbread market, driven by the widespread consumption of traditional products such as roti, chapati, naan, paratha, and other regional flatbreads. Market dynamics are influenced by urbanization, rising disposable incomes, growth of modern retail, and increasing demand for packaged, frozen, and ready-to-cook food products. Lucrative opportunities are visible in automated flatbread production, premium and fortified variants, frozen convenience formats, and products tailored to regional tastes. The forecast remains robust as consumers increasingly adopt branded and packaged alternatives, while latest developments focus on shelf-life enhancement, regional flavor innovation, production automation, and expansion through supermarkets, online retail, and foodservice channels. Europe Tortilla and Flatbread Market Europe represents a mature and innovation-driven tortilla and flatbread market, supported by rising consumption of wraps, pita, naan, lavash, and Mediterranean-style flatbreads. Market dynamics are shaped by demand for convenient meals, ethnic food adoption, premium bakery products, and growing interest in whole-grain, sourdough, organic, and clean-label formulations. Lucrative opportunities are concentrated in artisanal flatbreads, plant-based meal solutions, gluten-free products, and chilled or frozen convenience formats. The forecast remains constructive as manufacturers strengthen regional distribution and private-label partnerships, while latest developments center on sustainable packaging, reduced-additive recipes, specialty grain usage, and product innovation aligned with health and wellness trends. Middle East & Africa Tortilla and Flatbread Market The Middle East & Africa tortilla and flatbread market is supported by the deep cultural importance of products such as pita, khubz, lavash, injera, and other staple flatbreads. Market dynamics are influenced by population growth, urbanization, foodservice expansion, tourism, and increasing investment in modern bakery production facilities. Lucrative opportunities are emerging in packaged flatbreads, frozen dough products, fortified variants, institutional supply, and export-oriented production. The forecast remains positive as traditional consumption combines with growing demand for branded and convenience products, while latest developments focus on automated baking lines, improved packaging, longer shelf life, local grain sourcing, and stronger distribution across retail and hospitality channels. South & Central America Tortilla and Flatbread Market South & Central America presents substantial opportunities in the tortilla and flatbread market, supported by the deeply established consumption of corn and wheat tortillas, arepas, wraps, and other regional bakery products. Market dynamics are shaped by traditional dietary patterns, urban retail growth, foodservice expansion, and demand for convenient packaged foods. Lucrative opportunities are visible in premium corn tortillas, fortified products, frozen formats, ready-to-heat flatbreads, and export-oriented manufacturing. The forecast remains encouraging as producers modernize facilities and expand branded offerings, while latest developments focus on product authenticity, healthier formulations, improved shelf stability, efficient grain sourcing, and broader distribution through supermarkets, convenience stores, and restaurant chains. Report Scope Parameter Tortilla and Flatbread Market Detail Base Year 2025 Estimated Year 2026 Forecast Period 2026-2034 Market Size-Units USD billion Market Splits Covered By Product Type, By Source, By Nutritional Profile, By Distribution Channel Countries Covered North America (USA, Canada, Mexico) Europe (Germany, UK, France, Spain, Italy, Rest of Europe) Asia-Pacific (China, India, Japan, Australia, Rest of APAC) The Middle East and Africa (Middle East, Africa) South and Central America (Brazil, Argentina, Rest of SCA) Analysis Covered Latest Trends, Driving Factors, Challenges, Trade Analysis, Price Analysis, Supply-Chain Analysis, Competitive Landscape, Company Strategies Customization 10% free customization (up to 10 analyst hours) to modify segments, geographies, and companies analyzed Post-Sale Support 4 analyst hours, available up to 4 weeks Delivery Format The Latest Updated PDF and Excel Data file

Published:Jul-2026

Dried Fruit Snacks Market Analysis and Outlook Report: Industry Size, Share, Growth Trends, and Forecast (2026-2034)

The Dried Fruit Snacks Market has developed into a vibrant segment within the broader healthy snacking industry, supported by rising consumer interest in convenient, naturally derived, and minimally processed snack choices. Dried fruit snacks include products such as raisins, dates, apricots, prunes, figs, berries, mango, apple chips, tropical fruit blends, and mixed fruit snack packs designed for direct consumption across home, office, travel, school, and outdoor occasions. Their appeal lies in combining portability, shelf stability, natural sweetness, and a fruit-based positioning that resonates with consumers seeking alternatives to conventional salty and sugary snacks. The market is also benefiting from increasing snackification of daily diets, as more consumers replace traditional eating patterns with smaller, more frequent snack occasions. Dried fruit snacks are widely used as standalone snacks and in lunchboxes, trail mixes, breakfast bowls, yogurt toppings, and bakery inclusions, which broadens their relevance across age groups and consumption settings. Category innovation has accelerated in recent years, with manufacturers introducing organic lines, no-added-sugar products, freeze-dried fruit crisps, infused fruit variants, and fruit-based bites blended with seeds, nuts, and functional ingredients. These developments are helping brands reposition dried fruit from a traditional pantry item into a modern, lifestyle-oriented snack solution. As wellness, clean-label preferences, and on-the-go convenience continue to influence purchase decisions, the market is gaining momentum across both mass-market and premium retail channels. Competitive dynamics in the Dried Fruit Snacks market are shaped by raw material quality, sourcing transparency, texture differentiation, packaging innovation, and brand positioning around health, simplicity, and authenticity. Established dried fruit processors compete alongside organic snack specialists, better-for-you food brands, and emerging innovators developing premium and functional fruit-based snack formats. One of the most important trends in the market is the emphasis on clean ingredient profiles, with brands highlighting whole fruit content, absence of artificial additives, and natural sweetness as key differentiators. Another notable development is the growing popularity of portion-controlled packs, resealable pouches, and family-friendly formats that improve portability and encourage repeat consumption. Demand is also being reinforced by consumer preference for plant-based, gluten-free, and recognizable snacks that offer sensory satisfaction without appearing overly processed. At the same time, the market faces challenges related to fruit sourcing consistency, seasonal availability, moisture and texture control, and pricing sensitivity in premium segments. Companies that can balance taste, appearance, nutritional appeal, and affordability are best positioned to gain market share. Overall, the Dried Fruit Snacks market is evolving toward broader flavor diversity, stronger wellness credentials, and more sophisticated segmentation by consumer lifestyle, usage occasion, and ingredient purity, making it an increasingly important category within the global healthy snacks landscape. Key Market Insights Healthy snacking continues to serve as the strongest foundation for the Dried Fruit Snacks market. Consumers are increasingly choosing snacks that appear natural, fruit-based, and less processed than traditional indulgent alternatives. Dried fruit fits well within this shift because it offers familiarity, convenience, and a wholesome image. Its acceptance is growing among families, working professionals, and wellness-oriented consumers seeking better everyday snack options. This positioning has helped dried fruit snacks move from a niche category into broader mainstream consumption. Future market growth will remain closely tied to the continued expansion of health-conscious snacking habits. Product format innovation is reshaping the competitive landscape of the market. While traditional dried fruits such as raisins, dates, apricots, and prunes remain important, the category is expanding through fruit crisps, mixed fruit blends, bite-sized clusters, and infused fruit snacks. These formats create stronger visual appeal, greater texture variety, and better relevance for younger and more experimental consumers. Innovation in shape, texture, and combination formats is helping brands refresh a category that was once seen as traditional and limited. This evolution is increasing the market’s reach across premium retail, convenience channels, and wellness-led product segments. Clean-label positioning is becoming one of the most important purchase drivers in the category. Consumers are paying closer attention to ingredient simplicity and are increasingly drawn to products with recognizable, minimally processed components. Dried fruit snacks naturally benefit from this trend because they can be positioned around whole-fruit content, straightforward labeling, and natural sweetness. Products marketed with no added sugar, no preservatives, and limited ingredients tend to attract greater interest in health-focused and premium channels. As clean eating preferences continue to shape retail demand, brands that communicate purity and transparency effectively are likely to gain stronger traction. Convenience and portability are expanding consumption across multiple everyday occasions. Dried fruit snacks are easy to carry, store, portion, and consume, which makes them highly compatible with modern lifestyles. They are used in lunchboxes, office snacking, travel, fitness routines, and casual at-home eating, giving the category broad daypart relevance. Packaging formats such as resealable pouches and portion-controlled packs further strengthen convenience-driven appeal. This adaptability has become especially important as consumers increasingly replace formal eating habits with smaller and more frequent snack moments. The category’s portability advantage will remain a major factor behind repeat demand. Natural sweetness gives dried fruit snacks a strong edge in the better-for-you snacking space. Many consumers want snacks that satisfy sweet cravings without feeling overly artificial or heavily processed. Dried fruit addresses this need by delivering sweetness through fruit itself, which supports a more wholesome and naturally indulgent product image. This makes the category competitive against confectionery, sugar-based snack bars, and other sweet packaged snacks. Fruits such as mango, berries, dates, and figs are especially effective in this role because of their rich taste and broad appeal. Natural sweetness will continue to be a central advantage in category messaging and product development. Premiumization is elevating the category beyond its traditional commodity roots. Brands are increasingly differentiating themselves through fruit quality, origin positioning, organic credentials, and improved drying techniques. These factors help transform dried fruit snacks into more aspirational and lifestyle-oriented products rather than simple pantry staples. Premium offerings also support innovation in packaging, flavor combinations, and targeted wellness positioning. As consumers become more willing to explore specialized fruit varieties and cleaner product concepts, premiumization is expected to remain a powerful driver of category evolution. It also offers suppliers an opportunity to improve differentiation in a crowded healthy-snack landscape. Functional snacking trends are broadening the role of dried fruit in modern food products. Dried fruit is now being used not only as a standalone snack but also in blended formats that include nuts, seeds, grains, and other health-positioned ingredients. In these applications, fruit provides sweetness, chewiness, and binding functionality while enhancing the product’s natural appeal. This makes it highly relevant in energy bites, breakfast snacks, active-lifestyle products, and balanced snacking solutions. The intersection of fruit with functional and wellness-led product concepts is creating new growth paths for the category. This trend is likely to deepen as snack makers seek cleaner ways to deliver taste and texture. Versatility across multiple end-use occasions is strengthening the market’s long-term resilience. Dried fruit snacks are consumed directly, but they also fit naturally into breakfast bowls, yogurt toppings, bakery mixes, trail blends, and family snack combinations. This flexibility allows the category to maintain relevance across various retail placements and household consumption patterns. Products that serve multiple functions tend to see stronger repeat usage because consumers can integrate them into different eating routines. This multi-occasion appeal reduces dependence on a single use case and supports broader market stability. Brands that promote dried fruit as both a snack and an ingredient can unlock wider consumer engagement. Geographic expansion is improving the global outlook for dried fruit snacks. Rising demand for healthier packaged foods, ongoing retail modernization, and growing awareness of fruit-based snacking are helping the category gain traction across diverse markets. Urban consumers in developing regions are increasingly open to portable, shelf-stable snacks that combine convenience with a natural image. At the same time, mature markets continue to drive premium, organic, and innovative product formats. This combination of mass-market expansion and premium-category development gives dried fruit snacks a favorable long-term growth profile. Success across regions will depend on adapting flavors, pack sizes, and price points to local preferences. Future competitive success will depend on balancing health appeal with taste, texture, and affordability. Consumers may initially be drawn to dried fruit snacks because of their natural and clean-label image, but repeat purchases depend heavily on product enjoyment and value perception. Texture consistency, moisture control, visual appeal, and satisfying flavor are critical to maintaining brand loyalty. At the same time, pricing must remain accessible enough to compete with other convenient snack options. The most successful brands will be those that combine wellness positioning with strong sensory performance and practical value. This balance will shape leadership in both mainstream and premium segments of the dried fruit snacks market. Regional Insights North AmericaDried Fruit Snacks market North America is a mature but highly innovation-driven market for dried fruit snacks, supported by strong consumer interest in healthier snacking, meal replacement through snacks, and convenient portable food formats. The region benefits from broad retail availability across supermarkets, club stores, natural-food chains, and e-commerce platforms, which helps dried fruit snacks reach both mainstream and premium buyers. Demand is being shaped by preferences for clean-label, no-added-sugar, organic, and portion-controlled offerings, especially among families, office consumers, and wellness-focused shoppers. Product development is also moving toward fruit blends, functional snack packs, and lunchbox-friendly formats that widen category usage across dayparts. EuropeDried Fruit Snacks market Europe’s dried fruit snacks market is characterized by strong emphasis on healthier snacking, clean ingredient positioning, and demand for products that align with organic, plant-based, and low-additive preferences. Consumers across the region increasingly view dried tropical fruits and fruit snacks as alternatives to more indulgent sweet snacks, which supports steady category relevance in both mass and specialty retail channels. Markets such as Germany, the United Kingdom, France, and the Netherlands remain important for premium and innovative fruit-snack launches, especially where sustainability, traceability, and ingredient transparency influence purchase decisions. Retailers are also expanding assortments with low-sugar, organic, and on-trend fruit snack varieties that support further category diversification. Asia-PacificDried Fruit Snacks market Asia-Pacific is emerging as the most dynamic growth region for dried fruit snacks, driven by urbanization, changing eating habits, rising disposable incomes, and the expansion of modern retail and digital commerce. Consumers in major markets are increasingly seeking healthier packaged snacks with natural ingredients, clean-label claims, and stronger nutritional positioning, which supports dried fruit’s appeal as a convenient better-for-you option. The region also benefits from strong familiarity with fruit-based foods and growing interest in packaged nuts, dried fruits, and blended snack products as both direct snacks and versatile food ingredients. Manufacturers that tailor flavors, formats, and price points to local preferences are well placed to capture demand across both premium and mass-market channels. Middle East & AfricaDried Fruit Snacks market The Middle East & Africa market is developing steadily as urbanization, a youthful population, and rising demand for ready-to-eat foods continue to expand the overall snack category. Dried fruit snacks are well aligned with regional demand for convenient products that can offer a healthier image than conventional snack alternatives, particularly in modern retail environments across the Gulf and selected African markets. Growth is also being supported by increasing investment in local food manufacturing and wider distribution through supermarkets, convenience stores, and promotional retail channels. Fruit-based snacks are gaining traction alongside broader healthy-snack adoption, especially where consumers are seeking portable products with simple ingredients and longer shelf life. South & Central AmericaDried Fruit Snacks market South & Central America presents a growing opportunity for dried fruit snacks as consumers increasingly shift toward natural, nutritious, and convenience-led snack choices. Brazil is a key market within the region, where demand is moving toward products perceived as cleaner, lower in artificial ingredients, and more aligned with wellness-oriented eating habits. In Chile and other developing markets, on-the-go lifestyles and rising interest in plant-based, low-sugar, and single-serve healthy snacks are improving the category outlook for dried fruits and fruit-nut blends. The region’s growth potential is further supported by increasing acceptance of dehydrated fruits in packaged food retail, especially where brands can balance affordability with health-focused positioning. Report Scope Parameter Dried Fruit Snacks market Detail Base Year 2024 Estimated Year 2025 Forecast Period 2026-2034 Market Size-Units USD million Market Splits Covered By Product Type, By Fruit Type, By Nature, By End-User Countries Covered North America (USA, Canada, Mexico) Europe (Germany, UK, France, Spain, Italy, Rest of Europe) Asia-Pacific (China, India, Japan, Australia, Rest of APAC) The Middle East and Africa (Middle East, Africa) South and Central America (Brazil, Argentina, Rest of SCA) Analysis Covered Latest Trends, Driving Factors, Challenges, Trade Analysis, Price Analysis, Supply-Chain Analysis, Competitive Landscape, Company Strategies Customization 10% free customization (up to 10 analyst hours) to modify segments, geographies, and companies analyzed Post-Sale Support 4 analyst hours, available up to 4 weeks Delivery Format The Latest Updated PDF and Excel Data file

Published:Mar-2026