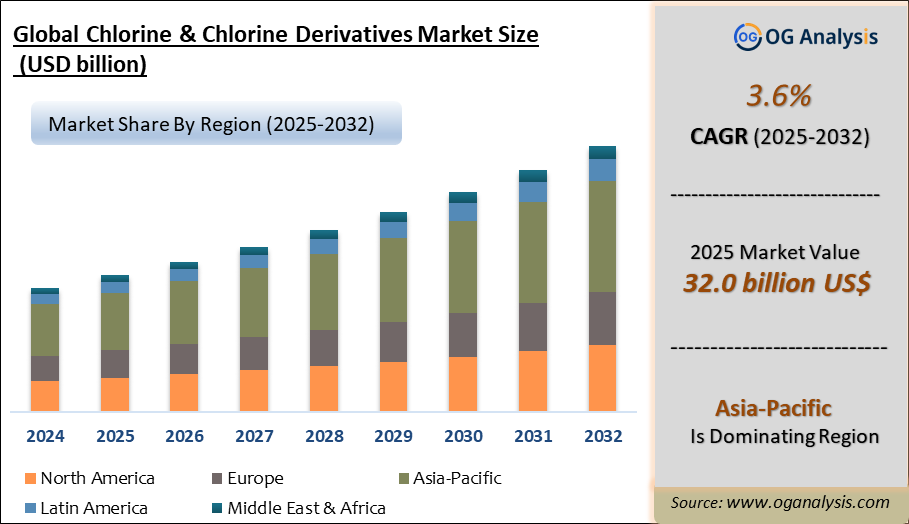
"The Chlorine & Chlorine Derivatives Market Size was valued at $31.1 billion in 2024 and is projected to reach $32.0 billion in 2025. Worldwide sales of Chlorine & Chlorine Derivatives are expected to grow at a significant CAGR of 3.6%, reaching USD 44.5 billion by the end of the forecast period in 2034."
The global chlorine and chlorine derivatives market is witnessing stable growth driven by extensive applications in water treatment, chemicals manufacturing, pharmaceuticals, and plastics production. Chlorine is a vital industrial chemical used for disinfection, bleaching, and as a raw material for producing derivatives such as hydrochloric acid, sodium hypochlorite, polyvinyl chloride (PVC), chlorinated paraffins, and other organochlorines. Growing urbanisation, stringent regulations on water sanitation, and rising demand for PVC in construction and infrastructure sectors are major growth drivers. The market is characterised by vertically integrated players, strategic expansions, and capacity enhancements to meet rising consumption across regions. However, environmental concerns regarding chlorine production and safety risks are leading companies to adopt sustainable manufacturing practices and efficient waste management systems.
Asia-Pacific dominates the market, driven by China and India’s industrial growth, expanding water treatment facilities, and robust PVC demand in construction and automotive industries. North America and Europe remain mature markets with strict environmental regulations prompting technological advancements for chlorine production efficiency and reduced emissions. Key companies are focusing on regional expansions, partnerships, and product innovations to strengthen their market positions. Increasing investments in chemical intermediates, pharmaceuticals, and agrochemicals continue to augment demand for chlorine derivatives globally. Meanwhile, the market is experiencing a gradual shift towards green chemistry initiatives and circular economy models to mitigate environmental impact while ensuring continued growth and application expansion in diverse industries.
By type, calcium chloride is the largest segment due to its wide-ranging applications in de-icing, dust control, water treatment, and as a drying agent in various industries. Its cost-effectiveness, high solubility, and ease of handling make it a preferred chlorine derivative across construction, oil & gas, and food processing sectors globally.
By application, water and wastewater treatment is the largest segment as chlorine derivatives such as calcium chloride, sodium chlorate, and iron chloride are extensively used for water purification, disinfection, and sludge treatment. Rising urbanisation, stringent environmental regulations, and the need for safe potable water are driving consistent demand growth in this segment worldwide.
Trade Intelligence for chlorine and chlorine derivatives market
| Global Chlorine Trade, Imports, USD million, 2020-24 | |||||
|
| 2020 | 2021 | 2022 | 2023 | 2024 |
| World | 174 | 220 | 351 | 352 | 368 |
| United States of America | 41.2 | 67.6 | 177 | 174 | 215 |
| Belgium | 4.34 | 5.46 | 6.41 | 7.03 | 10.7 |
| Dominican Republic | 6.08 | 5.45 | 8.67 | 7.93 | 7.39 |
| Ukraine | 1.74 | 1.10 | 3.92 | 6.48 | 6.30 |
| Philippines | 3.63 | 4.94 | 5.97 | 6.04 | 6.16 |
| Source: OGAnalysis, International Trade Centre (ITC) | |||||
- United States of America, Belgium, Dominican Republic, Ukraine and Philippines are the top five countries importing 66.7% of global Chlorine in 2024
- Global Chlorine Imports increased by 111.5% between 2020 and 2024
- United States of America accounts for 58.4% of global Chlorine trade in 2024
- Belgium accounts for 2.9% of global Chlorine trade in 2024
- Dominican Republic accounts for 2% of global Chlorine trade in 2024
| Global Chlorine Export Prices, USD/Ton, 2020-24 |
|
|
| Source: OGAnalysis |

Key Insights
- The chlorine and chlorine derivatives market is primarily driven by the water treatment industry, where chlorine serves as a highly effective disinfectant for municipal and industrial water purification processes, ensuring safe potable water supply and compliance with stringent hygiene and public health standards globally.
- Polyvinyl chloride (PVC) remains the largest derivative segment, with significant demand from construction, automotive, and electrical industries due to its durability, chemical resistance, and cost-effectiveness, prompting companies to expand chlorine capacities to secure PVC production value chains.
- Hydrochloric acid, a major chlorine derivative, is extensively used in steel pickling, oil well acidising, food processing, and chemical manufacturing, with demand supported by infrastructure development, industrial growth, and diversified downstream applications across regions.
- Asia-Pacific leads the market, driven by robust manufacturing activities, rising urban infrastructure projects, expanding chemical industries, and growing need for clean drinking water, with China and India accounting for the largest consumption shares regionally and globally.
- Environmental concerns over chlorine production, storage, and transportation safety risks have prompted companies to invest in advanced production technologies, sustainable practices, and stringent compliance measures to reduce emissions and mitigate health and ecological hazards.
- Sodium hypochlorite is witnessing rising demand as a household and industrial bleaching and disinfecting agent, particularly driven by heightened hygiene awareness post-pandemic and widespread applications in sanitation, cleaning, and wastewater treatment processes globally.
- Key players are focusing on capacity expansions, mergers, and strategic partnerships to strengthen supply security, optimise distribution networks, and gain competitive advantage in emerging markets with growing industrial chemical consumption and infrastructural investments.
- The market is witnessing a gradual shift towards green chemistry initiatives, including alternative chlorination processes and circular economy models to improve sustainability and address increasing regulatory and environmental concerns in the chemical manufacturing sector.
- Chlorinated paraffins continue to find applications as flame retardants, plasticisers, and lubricants in metalworking fluids, rubber, paints, and sealants industries, driving their demand despite regulatory scrutiny in some regions due to environmental and toxicity concerns.
- Technological advancements in membrane cell chlor-alkali production processes have enabled enhanced energy efficiency, reduced environmental footprint, and operational cost reductions, supporting industry profitability and compliance with global environmental standards.
Regional Insights
North America Chlorine & Chlorine Derivatives Market Analysis
North America’s chlorine and chlorine derivatives market is shaped by steady base demand from PVC and vinyls value chains, water and wastewater treatment, pulp and paper, and a broad range of chemical intermediates used in consumer and industrial products. Market dynamics are strongly linked to operating rates and planned maintenance of chlor-alkali assets, electricity and natural gas economics, and the regional balance of caustic soda co-product demand, which influences overall plant utilization and pricing behavior. Lucrative opportunities are emerging in higher-value derivatives and downstream integration, including chlorinated intermediates for pharmaceuticals and agrochemicals, high-purity chlor-alkali products for electronics-related uses, and specialty chlorinated compounds used in performance materials. Latest trends include energy-efficiency upgrades, digital process controls to improve reliability and safety, and contract structures that help stabilize supply for large users in building materials and packaging. Over the forecast period, growth is expected to be supported by infrastructure-linked PVC demand, continued focus on drinking water safety and industrial water reuse, and incremental reshoring or expansion of downstream manufacturing, while companies with advantaged feedstock, resilient logistics, and flexible derivative portfolios are best positioned to capture margin opportunities.
Asia Pacific Chlorine & Chlorine Derivatives Market Analysis
Asia Pacific represents the most expansionary region for chlorine and chlorine derivatives, supported by strong downstream pull from PVC, isocyanates and polyurethanes, chlorinated solvents and intermediates, and rising municipal water treatment investments. Market dynamics reflect ongoing capacity additions and periodic supply tightness driven by maintenance cycles, power constraints, and logistics limitations, with pricing and trade flows influenced by local integration into vinyls chains and co-product caustic soda demand from alumina, detergents, and textiles. Lucrative opportunities lie in integrated chlor-alkali-to-derivatives projects, localization of strategic intermediates for pharmaceuticals and crop protection, and higher-spec products aligned with electronics manufacturing ecosystems. Latest trends include modernization of membrane cell technology, tighter emissions and safety compliance, and investments in storage and distribution infrastructure to improve supply reliability. Over the forecast period, demand is expected to be reinforced by urban construction, expanding consumer goods production, and water infrastructure upgrades, while competitive advantage will increasingly depend on energy access, operational excellence, and proximity to large captive downstream consumers.
Europe Chlorine & Chlorine Derivatives Market Analysis
Europe’s market is characterized by high regulatory scrutiny, strong sustainability expectations, and an industry focus on efficiency, safety, and decarbonization, which collectively influence operating costs and capacity rationalization decisions. Market dynamics are tied to energy price volatility, compliance-driven investments, and downstream performance in PVC, chemicals, and industrial manufacturing, while trade and intra-regional logistics play a major role in balancing supply. Lucrative opportunities exist in value-added derivatives serving pharmaceuticals, specialty polymers, and high-performance materials, as well as in circular economy initiatives that improve resource efficiency and reduce lifecycle impacts across the chlorinated value chain. Latest trends include energy optimization, electrification and heat-integration projects, digital monitoring for process safety, and greater reliance on long-term supply agreements to manage volatility. Over the forecast period, growth is expected to be moderate and closely linked to industrial recovery and infrastructure renovation, with winners being those that can maintain cost competitiveness through energy strategy, operational reliability, and differentiated downstream integration.
Middle East & Africa Chlorine & Chlorine Derivatives Market Analysis
The Middle East and Africa market is driven by a combination of municipal water treatment needs, expanding industrialization, and growing downstream plastics and chemicals activity in select hubs. Market dynamics are influenced by the pace of investment in chlor-alkali capacity, availability of competitively priced energy, and the development of local derivative chains that can reduce import dependence for key intermediates used in construction, detergents, and industrial processing. Lucrative opportunities are concentrated in water infrastructure projects, desalination and industrial water reuse systems that increase chlorine consumption, and integrated developments that pair chlorine with captive downstream demand such as PVC or chlorinated intermediates. Latest trends include new distribution partnerships, upgrades in safe handling and storage infrastructure, and targeted localization initiatives for essential chemical inputs. Over the forecast period, demand is expected to rise with population growth, infrastructure expansion, and stronger public health and water quality programs, while suppliers that can ensure consistent product availability, robust logistics, and compliance with evolving safety standards will gain share.
South & Central America Chlorine & Chlorine Derivatives Market Analysis
South and Central America’s market is supported by steady needs in water and wastewater treatment, mining and metals processing, pulp and paper, and PVC-related construction demand, with supply dynamics varying by country depending on local chlor-alkali capacity and import reliance. Market dynamics often reflect cyclical industrial activity, infrastructure spending, and logistics constraints that can tighten regional availability during outages or peak demand periods. Lucrative opportunities lie in improving domestic supply resilience through debottlenecking and reliability investments, expanding derivatives used in sanitation, food processing, and industrial chemicals, and developing closer alignment with mining and infrastructure growth corridors. Latest trends include modernization of plants to improve energy efficiency and environmental compliance, more structured contract models for large municipal and industrial buyers, and portfolio expansion into higher-value derivatives where feasible. Over the forecast period, growth is expected to track water quality initiatives, construction cycles, and industrial output, with competitive advantage centered on dependable supply chains, safety performance, and integration into local downstream ecosystems.
Report Scope
| Parameter | Chlorine & Chlorine Derivatives Market Scope Detail |
| Base Year | 2024 |
| Estimated Year | 2025 |
| Forecast Period | 2026-2034 |
| Market Size-Units | USD billion |
| Market Splits Covered | By Product Type, By Diagnostic Method, By End User |
| Countries Covered | North America (USA, Canada, Mexico) |
| Analysis Covered | Latest Trends, Driving Factors, Challenges, Trade Analysis, Price Analysis, Supply-Chain Analysis, Competitive Landscape, Company Strategies |
| Customization | 10% free customization (up to 10 analyst hours) to modify segments, geographies, and companies analyzed |
| Post-Sale Support | 4 analyst hours, available up to 4 weeks |
| Delivery Format | The Latest Updated PDF and Excel Data file |
Market Segmentation
By Type
- Chromium Chloride
- Iron Chloride
- Copper Chloride
- Calcium Chloride
- Sodium Chlorate
- Others
By Application
- Water and Wastewater Treatment
- Textile Bleaching
- Solvent Manufacturing
- Insecticide Manufacturing
- Cosmetics and Personal Care
- Others
By Geography
- North America (USA, Canada, Mexico)
- Europe (Germany, UK, France, Spain, Italy, Rest of Europe)
- Asia-Pacific (China, India, Japan, Australia, Rest of APAC)
- The Middle East and Africa (Middle East, Africa)
- South and Central America (Brazil, Argentina, Rest of SCA)
Market Players
1. The Dow Chemical Company
2. Olin Corporation
3. Occidental Petroleum Corporation
4. Westlake Chemical Corporation
5. Tata Chemicals Limited
6. BASF SE
7. Ineos Group Holdings S.A.
8. Ercros S.A.
9. Tosoh Corporation
10. Formosa Plastics Corporation
11. Hanwha Solutions Corporation
12. Shin-Etsu Chemical Co., Ltd.
13. PPG Industries, Inc.
14. FMC Corporation
15. Axiall Corporation
Recent Developments
-
16 Dec 2025 – thyssenkrupp nucera
thyssenkrupp nucera announced it signed a contract to supply electrolysers for a large-scale chlor-alkali project in the Middle East. The company positioned the order as a major win for its Chlor-Alkali business, with delivery tied to a multi-year project timeline. -
15 Dec 2025 – Westlake Corporation
Westlake approved a plan to cease operations at selected North American chlorovinyl and chlor-alkali related assets as part of a rationalization initiative. The company stated it will continue supplying customers from its remaining North American chlorovinyl facilities. -
13–14 Nov 2025 – Nuberg EPC / Al Ghaith Chemical Industries (Oman)
Nuberg EPC announced it secured an EPC award for a chlor-alkali expansion project in Sur Industrial City, Oman, alongside a calcium chloride plant. The project aims to expand regional downstream chemical capability and improve local supply availability. -
23 Oct 2025 – Asahi Kasei
Asahi Kasei announced official approval of new facilities at its Kawasaki Works to expand manufacturing of system components for chlor-alkali electrolysis (and alkaline water electrolysis). The expansion targets higher output and stronger supply support for electrolysis systems. -
02 Sep 2025 – Bondalti Chemicals
Bondalti announced successful start-up of its modernized chlor-alkali production facility in Estarreja, Portugal, incorporating new electrolyzers. The company highlighted improved efficiency and lower power consumption as key outcomes of the upgrade. -
Feb–Apr 2025 – Asahi Kasei / Nobian / Furuya Metal / Mastermelt
The partners announced a joint demonstration to recycle valuable metals used in chlor-alkali electrolyzer cells and electrodes, aiming to build a recycling ecosystem for the chlor-alkali industry. The initiative focuses on circularity and supply resilience for critical materials. -
28 Aug 2024 – Olin Corporation
Olin announced it lifted its systemwide force majeure on chlor-alkali products after restoring operations following hurricane-related disruption at its Freeport, Texas site. The update signaled normalization of supply for chlor-alkali and derivative products. -
12 Feb 2024 – INEOS Inovyn
INEOS Inovyn announced an Ultra Low Carbon chlor-alkali product range using renewable electricity to reduce the carbon footprint of chlorine and caustic products versus conventional production. The launch targets customers seeking lower-emissions inputs across chemical value chains.
FAQ's
The Chlorine & Chlorine Derivatives Market is estimated to reach USD 41.3 billion by 2032.
The Global Chlorine & Chlorine Derivatives Market is expected to grow at a Compound Annual Growth Rate (CAGR) of 3.6% during the forecast period from 2025 to 2032.
The Global Chlorine & Chlorine Derivatives Market is estimated to generate USD 31.1 billion in revenue in 2024.
Didn’t find what you’re looking for? TALK TO OUR ANALYST TEAM
Need something within your budget? NO WORRIES! WE GOT YOU COVERED!

