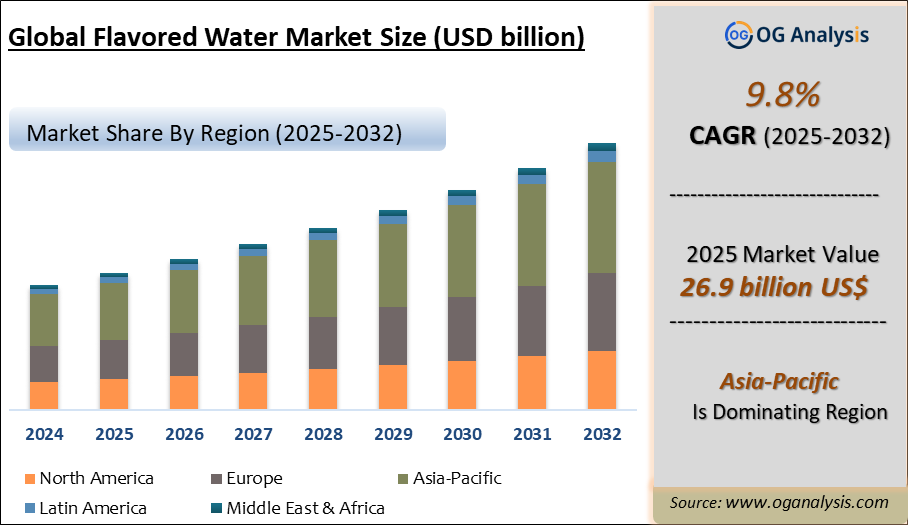
"The Flavored Water Market is valued at $ 26.9 billion in 2025. Further, the market is expected to grow at a CAGR of 9.8% to reach $ 62.1 billion by 2034."
The flavored water market includes a diverse range of still, sparkling, and functional beverages infused with natural or artificial flavours to enhance hydration experiences without adding significant calories. Consumers increasingly prefer flavored water as a healthier alternative to sugary carbonated drinks and juices, driven by rising awareness of sugar-related health risks and lifestyle diseases. The market encompasses products with fruit infusions, herbal extracts, botanical flavours, and enhanced waters with vitamins, minerals, or electrolytes for added functional benefits. Growth is supported by wellness trends, premiumisation of beverages, and innovative product development by global and regional beverage companies.
North America and Europe remain the largest markets, driven by mature health-conscious consumer bases and strong distribution networks, while Asia-Pacific is witnessing the fastest growth due to urbanisation, rising incomes, and increasing adoption of healthy hydration products. E-commerce and direct-to-consumer channels further boost sales, enabling brands to personalise offerings and build stronger consumer loyalty. Manufacturers focus on natural formulations, clean labels, sustainability in packaging, and unique flavour innovations to differentiate in a highly competitive market. As hydration becomes central to daily wellness routines, flavored water is poised for long-term growth worldwide.
By Industrial Application, Beverage Industry is the largest segment as flavored water is primarily produced and marketed by beverage manufacturers targeting mass-market consumers. Its dominance is driven by strong distribution networks, high-volume production capabilities, and continuous product innovations catering to evolving hydration and flavour preferences.
By Flavor, Citrus is the largest segment due to its wide consumer acceptance, refreshing taste profile, and suitability for both still and sparkling flavored water formulations. Citrus flavours such as lemon, lime, and orange are preferred globally for their natural association with hydration, energy, and clean-label positioning.
Key Insights
- Consumer preference for low-calorie hydration options is a primary driver, with flavored water positioned as a healthier alternative to sodas and juices, catering to daily hydration needs without sugar-related health concerns.
- Sparkling flavored water continues to gain traction as consumers seek carbonated beverages with refreshing taste profiles and no added sugars or artificial sweeteners, offering a guilt-free alternative to traditional soft drinks.
- Natural flavours such as citrus, berry, cucumber, and herbal infusions are increasingly used to create authentic taste experiences, aligning with clean-label trends and consumer demand for naturally derived ingredients.
- Asia-Pacific is the fastest-growing regional market, fuelled by rapid urbanisation, rising middle-class incomes, and increased health awareness driving demand for premium hydration products with flavour and functionality.
- Functional flavored waters enriched with vitamins, electrolytes, probiotics, and antioxidants are expanding their consumer base, addressing hydration along with immunity, digestive health, and energy-boosting needs.
- E-commerce platforms and direct-to-consumer sales strategies are strengthening market reach by offering subscription packs, personalised flavour selections, and convenience for health-focused urban consumers.
- Major beverage companies are expanding flavored water portfolios through acquisitions and brand extensions to diversify revenue streams and adapt to declining carbonated soft drink consumption trends globally.
- Innovations in eco-friendly packaging, including recyclable bottles, plant-based plastics, and aluminium cans, align with sustainability goals and strengthen brand image among environmentally conscious consumers.
- Product differentiation strategies focus on unique flavour combinations, organic certifications, natural sweeteners like stevia, and premium branding to attract health-conscious and lifestyle-oriented consumers.
- Partnerships with gyms, fitness centres, wellness influencers, and retail chains are enhancing brand awareness, positioning flavored water as an integral part of active lifestyles, daily hydration, and health routines worldwide.
Global citrus fruit production (all citrus types), 2018–2022
Figure: Global citrus fruit production increased from around 152 million tonnes in 2018 to an estimated 171 million tonnes in 2024e. As oranges, lemons, limes and other citrus crops expand worldwide, beverage manufacturers gain a deeper raw-material base for natural flavors, concentrates and citric acid used in flavored water. OG Analysis estimates, derived from FAO and international citrus market data, illustrate how rising citrus availability supports long-term growth and flavor innovation in the flavored water market.

The flavored water market is expanding as consumers seek healthier, low-calorie hydration infused with natural citrus extracts, botanicals, and functional ingredients. Rising global citrus production supports wider flavor innovation, clean-label positioning, and cost stability for manufacturers. Strengthening distribution across retail, convenience, and on-the-go channels continues to elevate product visibility and long-term market growth.
Reort Scope
| Parameter | Flavored Water Market scope Detail |
| Base Year | 2024 |
| Estimated Year | 2025 |
| Forecast Period | 2026-2032 |
| Market Size-Units | USD billion |
| Market Splits Covered | By Product, By Application, By End User and By Technology |
| Countries Covered | North America (USA, Canada, Mexico) |
| Analysis Covered | Latest Trends, Driving Factors, Challenges, Trade Analysis, Price Analysis, Supply-Chain Analysis, Competitive Landscape, Company Strategies |
| Customization | 10% free customization (up to 10 analyst hours) to modify segments, geographies, and companies analyzed |
| Post-Sale Support | 4 analyst hours, available up to 4 weeks |
| Delivery Format | The Latest Updated PDF and Excel Data file |
Market Segmentation
By Type
- Carbonated
- Still
By Distribution Channel
- Store-based
- Supermarkets And Hypermarkets
- Convenience Store
By Packing
- Bottle
- Can
- Box
- Pouch
By Industrial Application
- Beverage Industry
- Brewery Industry
- Health And Wellness Industry
- Other Industry Applications
By Flavor
- Blueberry
- Watermelon
- Cola
- Coconut
- Citrus
- Unflavored
By Geography
- North America (USA, Canada, Mexico)
- Europe (Germany, UK, France, Spain, Italy, Rest of Europe)
- Asia-Pacific (China, India, Japan, Australia, Vietnam, Rest of APAC)
- The Middle East and Africa (Middle East, Africa)
- South and Central America (Brazil, Argentina, Rest of SCA)
Key Market Players
- Cargill Incorporated
- Nestlé S.A.
- PepsiCo Inc.
- DS Group
- The Coca-Cola Company
- Mondelez International Inc.
- The Kraft Heinz Company
- Hangzhou Wahaha Group Co. Ltd.
- Keurig Dr Pepper Inc.
- Red Bull GmbH
- National Beverage Corp.
- National Beverage Corp.
- Aquafina FlavorSplash
- Sanpellegrino S.p.A.
- Talking Rain Beverage Company Inc.
- Polar Beverages (Polar Seltzer)
- Propel Water
- Hint Inc.
- Waterloo Sparkling Water
- Nanone Corporation
- Talking Rain Beverage Company Inc. (Sparkling Ice)
- Balance Water Company Pty Ltd.
- Blue Keld Springs Ltd.
- Spindrift Beverage Co.
- Daily Drinks Co. Ltd.
- Saratoga Spring Water Company
- Xalta Food & Beverages Pvt Ltd
- Neviot Global Ltd.
- Sunny Delight Beverages Co.
- JUST Goods Inc.
What You Receive
• Global Flavored Water market size and growth projections (CAGR), 2024- 2034
• Impact of recent changes in geopolitical, economic, and trade policies on the demand and supply chain of Flavored Water.
• Flavored Water market size, share, and outlook across 5 regions and 27 countries, 2025- 2034.
• Flavored Water market size, CAGR, and Market Share of key products, applications, and end-user verticals, 2025- 2034.
• Short and long-term Flavored Water market trends, drivers, restraints, and opportunities.
• Porter’s Five Forces analysis, Technological developments in the Flavored Water market, Flavored Water supply chain analysis.
• Flavored Water trade analysis, Flavored Water market price analysis, Flavored Water Value Chain Analysis.
• Profiles of 5 leading companies in the industry- overview, key strategies, financials, and products.
• Latest Flavored Water market news and developments.
The Flavored Water Market international scenario is well established in the report with separate chapters on North America Flavored Water Market, Europe Flavored Water Market, Asia-Pacific Flavored Water Market, Middle East and Africa Flavored Water Market, and South and Central America Flavored Water Markets. These sections further fragment the regional Flavored Water market by type, application, end-user, and country.
FAQ's
The Flavored Water Market is estimated to reach USD 62.1 billion by 2034.
The Global Flavored Water Market is expected to grow at a Compound Annual Growth Rate (CAGR) of 9.8% during the forecast period from 2025 to 2034.
The Global Flavored Water Market is estimated to generate USD 26.9 billion in revenue in 2025.
Didn’t find what you’re looking for? TALK TO OUR ANALYST TEAM
Need something within your budget? NO WORRIES! WE GOT YOU COVERED!

