"The Glass Container Market was valued at $ 43.23 billion in 2026 and is projected to reach $ 73.98 billion by 2034, growing at a CAGR of 6.94%."
The glass container market is a vital part of the global packaging industry, known for its durability, recyclability, and ability to preserve product integrity. Glass containers are widely used across food, beverages, pharmaceuticals, cosmetics, and chemicals, providing a safe and premium packaging solution that appeals to both businesses and consumers. The market is driven by growing consumer preference for sustainable packaging materials that are free from harmful chemicals and ensure product freshness. Beverage applications, especially alcoholic drinks, juices, and premium water, dominate demand due to glass’s inert properties and premium aesthetic value. Additionally, regulatory encouragement for reducing plastic waste and rising adoption of eco-friendly materials are reinforcing the growth trajectory of glass containers across multiple sectors worldwide.
Innovation in design, lightweighting technologies, and customization options are reshaping the glass container market, making products more competitive against alternatives like plastics and metals. Emerging economies are witnessing significant demand due to expanding urbanization, increasing disposable incomes, and growing consumer awareness of sustainable packaging choices. Meanwhile, developed regions are experiencing strong replacement demand in premium beverages and cosmetics, supported by recycling initiatives and closed-loop systems. The market outlook remains robust, with companies investing in advanced manufacturing technologies, automation, and high-performance furnaces to meet efficiency and environmental standards. As a result, the glass container industry is evolving as a balance between tradition and innovation, positioning itself as a cornerstone of sustainable packaging in the global economy.
Key Market Insights
-
The glass container market is gaining momentum as consumer preferences shift toward sustainable, reusable, and recyclable packaging solutions. This change is reinforced by stricter government regulations on single-use plastics, which are driving industries such as beverages, cosmetics, and pharmaceuticals to adopt glass as a safer and eco-friendly alternative.
-
Beverages continue to dominate demand for glass containers, particularly in the premium alcohol, wine, spirits, and craft beer segments. The perception of glass as a superior packaging material that preserves flavor, prevents chemical interaction, and enhances brand image is fueling long-term growth in this application segment.
-
Lightweight glass technology has become a key innovation in the industry, aimed at reducing transportation costs, minimizing carbon emissions, and maintaining container strength. This trend is enabling manufacturers to stay competitive with alternatives such as PET bottles and aluminum cans, while meeting sustainability expectations.
-
Glass containers are widely preferred in pharmaceuticals and healthcare due to their chemical inertness, impermeability, and ability to protect sensitive formulations. Demand is further driven by the rise of vaccines, biologics, and specialized drugs that require packaging integrity and extended shelf life.
-
Customization and premiumization are shaping the competitive landscape, with companies investing in unique designs, embossing, labeling, and decorative techniques. This enhances brand differentiation and creates added value for products in high-end categories such as luxury cosmetics, gourmet foods, and specialty beverages.
-
Circular economy models are becoming integral to the glass container industry, with increasing investments in recycling infrastructure and closed-loop systems. High recycling rates in regions such as Europe are setting benchmarks, pushing other regions to adopt similar models and driving sustainability commitments across the supply chain.
-
Emerging economies in Asia-Pacific and Latin America present significant opportunities for growth, as urbanization, rising disposable incomes, and evolving consumer lifestyles drive demand for packaged food, beverages, and personal care products. This is encouraging global players to expand production capacities and establish localized supply networks.
-
Automation and digitalization in glass container manufacturing are enhancing efficiency, quality control, and throughput. Modern furnaces and Industry 4.0-enabled processes are being deployed to reduce operational costs, improve consistency, and meet stringent environmental regulations in production.
-
Rising energy costs and raw material price volatility remain challenges for glass container manufacturers. Companies are countering these pressures by adopting energy-efficient technologies, waste heat recovery systems, and renewable energy integration within their production facilities to maintain competitiveness.
-
The premium perception of glass as a safe, high-quality, and sustainable packaging choice continues to elevate its role in consumer marketing. Brands are increasingly highlighting their use of recyclable glass containers as part of corporate social responsibility strategies, reinforcing consumer loyalty and environmental awareness.
Global soda ash production (million tonnes), 2018–2024
Figure: Global soda ash production increased from about 57.0 million tonnes in 2018 to an estimated 73.0 million tonnes in 2024e, providing a steadily expanding base of a key batch ingredient used in soda-lime container glass. As soda ash is blended with silica sand and limestone in glass batch preparation, manufacturers can support higher melt volumes and consistent throughput for bottles and jars serving food, beverage and pharmaceutical end uses. OG Analysis estimates, derived from USGS soda ash production statistics and global industrial minerals assessments, illustrate how rising soda ash output strengthens long-term raw material availability, regional supply resilience and cost visibility across the glass container market.
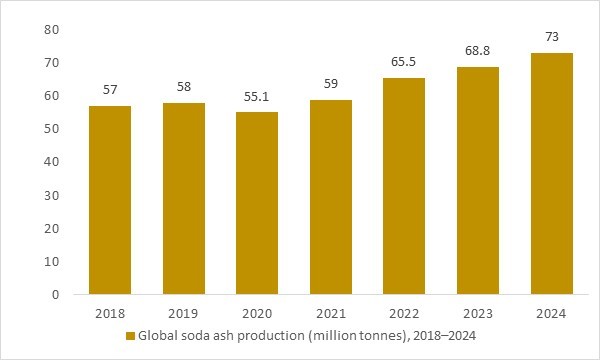
Global soda ash production increased from about 57 million tonnes in 2018 to an estimated 73 million tonnes in 2024e, indicating a materially stronger raw material base for container glass manufacturing. After a temporary dip in 2020, output rebounded sharply, reflecting capacity additions and higher operating rates across major producing regions. This expansion supports higher glass melting volumes and improved supply reliability for bottle and jar producers serving food, beverage, and pharmaceutical markets. Overall, the soda ash production trend underpins long-term capacity growth, cost dynamics, and supply security in the glass container market.
Regional Insights
North America – Glass Container Market
North America’s glass container market is shaped by steady beverages, food, pharmaceutical, and personal-care demand, with premiumization in spirits and craft categories supporting value growth alongside stable core volumes. Market dynamics emphasize lightweighting, higher recycled cullet usage, and shorter lead times through furnace rebuilds and regionalized supply, while brand owners seek design differentiation via embossing, direct-to-glass decoration, and specialty closures. Lucrative opportunities exist in low-carbon glass enabled by electrified and hybrid furnaces, closed-loop partnerships with materials recovery facilities, and refill/return pilots for on- and off-premise channels. Latest trends include ultra-clear formulations for premium water, amber and colored glass for UV-sensitive products, shatter-resistance enhancements for e-commerce, and smart traceability codes for authenticity and deposit management. The forecast points to resilient demand anchored in premium beverages and regulated pharma uses, with mix upgrading offsetting packaging substitution pressures. Recent developments feature capacity optimization projects, digital quality control at the hot and cold ends, and logistics collaborations that compress time-to-shelf and reduce breakage across regional distribution networks.
Asia Pacific – Glass Container Market
Asia Pacific exhibits broad-based expansion driven by urbanization, rising disposable incomes, and a pivot toward safer, inert, and brand-elevating packaging across beverages, nutraceuticals, cosmetics, and pharmaceuticals. Market dynamics prioritize cost-to-performance with factory automation, higher pull rates, and localized color and mold flexibility to serve fast-changing SKU portfolios. Companies find lucrative opportunities in greenfield furnaces near demand clusters, advanced cullet collection systems, and OEM/ODM programs supplying regional and global brands with customized shapes and finishes. Latest trends include single-serve premium beverages, herbal and functional tonics in amber glass, matte and frosted aesthetics for beauty, and QR-enabled engagement for provenance and loyalty. The forecast indicates accelerating penetration of lightweight containers that reduce freight intensity while preserving shelf presence and product stability. Recent developments include new melting capacity, hybrid/electric furnace trials to curb energy intensity, and hot-end digital printing that shortens design cycles and supports limited editions for online and festival-driven sales peaks.
Europe – Glass Container Market
Europe is a mature, sustainability-led market characterized by high recycling performance, strict producer-responsibility rules, and strong demand from wine, spirits, gourmet foods, and high-spec pharma. Market dynamics center on circularity with elevated cullet content, energy efficiency, and weight-reduction without compromising mechanical strength or line efficiency. Lucrative opportunities arise in refill/return systems, deposit-management services, and certified low-carbon glass that helps brand owners meet climate targets and eco-label criteria. Latest trends include ultra-light premium bottles, color-switch flexibility for seasonal runs, tactile finishes for sensorial branding, and digital product passports that document recycled content and carbon metrics. The forecast suggests stable volumes with ongoing premiumization and compliance-driven upgrades as supply chains decarbonize and cross-border specs harmonize. Recent developments feature furnace electrification and hydrogen-assisted melting pilots, consolidation to expand pan-European footprints, and integrated cullet partnerships that enhance feedstock quality and reduce variability across national collection streams.
Report Scope
| Parameter | Glass Container Market scope Detail |
| Base Year | 2024 |
| Estimated Year | 2025 |
| Forecast Period | 2026-2032 |
| Market Size-Units | USD billion |
| Market Splits Covered | By Product, By Application, By End User and By Technology |
| Countries Covered | North America (USA, Canada, Mexico) |
| Analysis Covered | Latest Trends, Driving Factors, Challenges, Trade Analysis, Price Analysis, Supply-Chain Analysis, Competitive Landscape, Company Strategies |
| Customization | 10% free customization (up to 10 analyst hours) to modify segments, geographies, and companies analyzed |
| Post-Sale Support | 4 analyst hours, available up to 4 weeks |
| Delivery Format | The Latest Updated PDF and Excel Data file |
Glass Container Market Segmentation
By Glass Type
- Borosilicate-Based
- Soda-Lime-Silica-Based
By Forming Method
- Blow And Blow
- Press And Blow
- Narrow Neck Press And Blow
By End User
- Food And Beverages
- Cosmetics And Personal Care
- Pharmaceuticals
- Chemical
- Other End-Users
By Geography
- North America (USA, Canada, Mexico)
- Europe (Germany, UK, France, Spain, Italy, Rest of Europe)
- Asia-Pacific (China, India, Japan, Australia, Vietnam, Rest of APAC)
- The Middle East and Africa (Middle East, Africa)
- South and Central America (Brazil, Argentina, Rest of SCA)
Key Market Players
Ardagh Group SA, Amcor PLC, Consol Glass Ltd, Owens-Illinois Inc, Saverglass Group, Amcor Limited, FrigoGlass, Vidrala SA, Central Glass Co, Vitro, Vidrala, Hindusthan National Glass & Industries Ltd, Gerresheimer AG, Verallia, Vetropack Group, AGI Glasspack Ltd, Bormioli Rocco, Stoelzle Glass Group, Piramal Glass Private Limited, HEINZ-GLAS GmbH & Co, Koa Glass Co Ltd, Nihon Yamamura Glass Co Ltd, Saint-Gobain, O-I Glass Inc, AGC Inc, Fuyao Glass Industry Group Co Ltd, Guardian Industries, PGP Glass Limited, Toyo Seikan Group Holdings Ltd., Zwiesel Glas Group
Recent Industry Developments
August 2025 – Owens-Illinois (O-I) permanently closed its Portland, Oregon glass plant, cutting regional capacity as part of its “Fit to Win” consolidation program.
September 2025 – Orora announced the shutdown of its G1 furnace at Gawler, South Australia, with production to be shifted partly offshore while maintaining two operating furnaces.
September 2024 – Verallia inaugurated a fully electric glass furnace at its Cognac site, a major step in reducing carbon emissions across glass container manufacturing.
FAQ's
The Global Glass Container Market is estimated to generate $ 40.43 billion in revenue in 2026.
The Global Glass Container Market is expected to grow at a Compound Annual Growth Rate (CAGR) of 6.94% during the forecast period from 2026 to 2034.
The Glass Container Market is estimated to reach $ 73.98 billion by 2034.
Didn’t find what you’re looking for? TALK TO OUR ANALYST TEAM
Need something within your budget? NO WORRIES! WE GOT YOU COVERED!

