Global Metal Additive Manufacturing Market Outlook Report: Latest Trends and Growth Opportunities by Region

Published On: Feb, 2025
|
Pages: 159

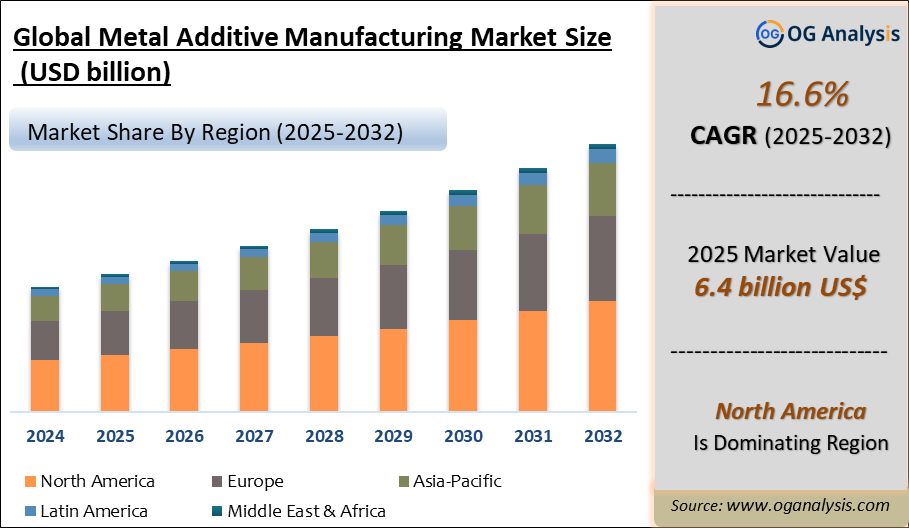
"The Global Metal Additive Manufacturing Market Size was valued at USD 5.6 billion in 2024 and is projected to reach USD 6.4 billion in 2025. Worldwide sales of Metal Additive Manufacturing are expected to grow at a significant CAGR of 16.6%, reaching USD 26.3 billion by the end of the forecast period in 2034."

The metal additive manufacturing market is experiencing rapid growth as industries increasingly adopt 3D printing technologies for producing complex metal components with improved performance, reduced weight, and optimized geometries that are challenging to achieve through traditional manufacturing. Metal additive manufacturing, also known as metal 3D printing, involves processes such as selective laser melting (SLM), electron beam melting (EBM), direct energy deposition (DED), and binder jetting to produce high-strength parts using materials like titanium, stainless steel, aluminum, and nickel alloys. Key end-user sectors include aerospace, defense, automotive, energy, and healthcare, where additive manufacturing enables lightweight designs, part consolidation, and on-demand production, significantly reducing lead times and material waste. The market growth is driven by advancements in printing technologies, expanded material availability, and increasing investments by OEMs and tier suppliers to integrate additive manufacturing into production workflows and supply chains.

Regionally, North America leads the metal additive manufacturing market, supported by strong aerospace, defense, and medical device sectors, along with early technology adoption and extensive R&D investments. Europe follows closely, driven by automotive lightweighting initiatives, aerospace component production, and advanced manufacturing research programs supported by the EU. Asia Pacific is the fastest-growing region, with rapid adoption in China, Japan, South Korea, and India due to expanding industrial manufacturing capabilities and government-supported innovation initiatives. However, challenges remain in terms of high equipment costs, process standardization, and qualification barriers for critical applications. Companies are investing in large-format printers, integrated software for generative design and process simulation, and developing qualified powder supply chains to support scalable production. As industries prioritize performance, customization, and supply chain resilience, the metal additive manufacturing market is poised for significant growth over the coming years.

Powder bed fusion is the largest segment by technology in the metal additive manufacturing market due to its extensive use in producing high-precision, high-strength components for aerospace, medical, and industrial applications, offering superior part density and dimensional accuracy. Direct energy deposition is the fastest-growing technology segment, driven by its application in repairing, refurbishing, and adding material to high-value components in aerospace and energy sectors, reducing costs and extending equipment life.

Aerospace is the largest application segment, as metal additive manufacturing is widely used for lightweight structural parts, engine components, and complex designs that improve fuel efficiency and performance while meeting stringent industry standards. Automobile is the fastest-growing application segment, fueled by the automotive industry’s focus on lightweighting, prototyping, tooling, and integration of complex metal parts to support electric vehicle production and innovative design solutions.

Metal Additive Manufacturing Market Analysis 2025-2032: Industry Size, Share, Growth Trends, Competition and Forecast Report


Trade Intelligence for metal additive manufacturing market

Global Machines and mechanical appliances, n.e.s. Trade, Imports, USD million, 2020-24


2020

2021

2022

2023

2024

World

         42,123

         49,069

         47,902

         50,402

         54,027

United States of America

           4,307

           5,216

           5,604

           6,438

           7,553

China

           8,327

           9,603

           8,429

           7,116

           6,880

Germany

           2,940

           3,020

           3,199

           3,403

           3,425

Mexico

           1,383

           2,006

           2,565

           2,659

           2,908

India

           1,025

           1,227

           1,205

           1,553

           2,010

Source: OGAnalysis, International Trade Centre (ITC)

- United States of America, China, Germany, Mexico and India are the top five countries importing 42.2% of global Machines and mechanical appliances, n.e.s. in 2024
- Global Machines and mechanical appliances, n.e.s. Imports increased by 28.3% between 2020 and 2024
- United States of America accounts for 14% of global Machines and mechanical appliances, n.e.s. trade in 2024
- China accounts for 12.7% of global Machines and mechanical appliances, n.e.s. trade in 2024
- Germany accounts for 6.3% of global Machines and mechanical appliances, n.e.s. trade in 2024

Global Machines and mechanical appliances, n.e.s. Export Prices, USD/Ton, 2020-24

Source: OGAnalysis


Key Insights

  • The metal additive manufacturing market is driven by rising demand for lightweight, complex, and high-performance metal components across aerospace, defense, automotive, and energy sectors to improve fuel efficiency, reduce emissions, and enhance product functionality.
  • Selective laser melting (SLM) is the largest technology segment, widely used for producing high-density, precision components in aerospace, medical implants, and tooling applications due to its superior mechanical properties and design flexibility.
  • Direct energy deposition (DED) is gaining traction for repair and refurbishment of high-value components in aerospace and energy sectors, enabling cost savings, extended part life, and reduced downtime for critical equipment maintenance.
  • North America dominates the market with strong adoption in aerospace, defense, and medical device manufacturing, supported by established OEM investments, robust R&D infrastructure, and specialized material suppliers driving innovation in metal AM.
  • Asia Pacific is the fastest-growing region, driven by rapid industrialization, expansion of aerospace manufacturing, government initiatives supporting additive manufacturing technology, and increasing investment in advanced production capabilities in China, Japan, and South Korea.
  • Automotive applications are expanding, as manufacturers leverage metal additive manufacturing for lightweight structural components, prototyping, and tooling, supporting electric vehicle development and improving manufacturing agility for design iterations.
  • Material advancements, including high-strength aluminum, titanium, and nickel-based superalloys, are broadening application scopes in high-temperature and corrosion-resistant environments across aerospace engines and energy turbines.
  • High equipment and operational costs remain challenges, prompting companies to focus on process optimization, powder recycling technologies, and integrated software solutions to reduce per-part production costs and improve scalability.
  • Certification, standardization, and qualification remain key barriers for aerospace and defense applications, driving collaborations between OEMs, research institutes, and regulatory bodies to establish robust qualification protocols and supply chain standards.
  • Strategic partnerships between metal AM equipment manufacturers, material suppliers, and end-users are increasing, facilitating technology integration, development of tailored materials, and adoption of additive manufacturing in mainstream production workflows for critical applications.

Report Scope

Parameter

metal additive manufacturing market scope Detail

Base Year

2024

Estimated Year

2025

Forecast Period

2026-2032

Market Size-Units

USD billion

Market Splits Covered

By Technology, By Component, By Application

Countries Covered

North America (USA, Canada, Mexico)
Europe (Germany, UK, France, Spain, Italy, Rest of Europe)
Asia-Pacific (China, India, Japan, Australia, Rest of APAC)
The Middle East and Africa (Middle East, Africa)
South and Central America (Brazil, Argentina, Rest of SCA)

Analysis Covered

Latest Trends, Driving Factors, Challenges, Trade Analysis, Price Analysis, Supply-Chain Analysis, Competitive Landscape, Company Strategies

Customization

10% free customization (up to 10 analyst hours) to modify segments, geographies, and companies analyzed

Post-Sale Support

4 analyst hours, available up to 4 weeks

Delivery Format

The Latest Updated PDF and Excel Data file

Market Segmentation

  • By Technology
  • Powder Bed Fusion
  • Binder Jetting
  • Direct Energy Deposition
  • Bound Powder Extrusion
  • Other Technologies
  • By Component
  • Systems
  • Materials
  • Service and parts
  • By Application
  • Aerospace
  • Healthcare
  • Tools and mold
  • Automobile
  • Others
  • By Geography
  • North America (USA, Canada, Mexico)
  • Europe (Germany, UK, France, Spain, Italy, Rest of Europe)
  • Asia-Pacific (China, India, Japan, Australia, Rest of APAC)
  • The Middle East and Africa (Middle East, Africa)
  • South and Central America (Brazil, Argentina, Rest of SCA)

What You Receive

• Global Metal Additive Manufacturing market size and growth projections (CAGR), 2024- 2034
• Impact of recent changes in geopolitical, economic, and trade policies on the demand and supply chain of Metal Additive Manufacturing.
• Metal Additive Manufacturing market size, share, and outlook across 5 regions and 27 countries, 2025- 2034.
• Metal Additive Manufacturing market size, CAGR, and Market Share of key products, applications, and end-user verticals, 2025- 2034.
• Short and long-term Metal Additive Manufacturing market trends, drivers, restraints, and opportunities.
• Porter’s Five Forces analysis, Technological developments in the Metal Additive Manufacturing market, Metal Additive Manufacturing supply chain analysis.
• Metal Additive Manufacturing trade analysis, Metal Additive Manufacturing market price analysis, Metal Additive Manufacturing Value Chain Analysis.
• Profiles of 5 leading companies in the industry- overview, key strategies, financials, and products.
• Latest Metal Additive Manufacturing market news and developments.
The Metal Additive Manufacturing Market international scenario is well established in the report with separate chapters on North America Metal Additive Manufacturing Market, Europe Metal Additive Manufacturing Market, Asia-Pacific Metal Additive Manufacturing Market, Middle East and Africa Metal Additive Manufacturing Market, and South and Central America Metal Additive Manufacturing Markets. These sections further fragment the regional Metal Additive Manufacturing market by type, application, end-user, and country.

Recent Developments 

  • Oerlikon expanded its additive manufacturing capacity by partnering with TRUMPF Additive Manufacturing, integrating multiple TruPrint systems to strengthen its metal AM production.
  • Agnikul Cosmos launched a large-format additive manufacturing facility dedicated to aerospace and rocket components, enabling integrated design, production, and finishing.
  • 3D Systems advanced its aerospace portfolio by securing a contract to develop a large-format metal 3D printing demonstrator designed for high-temperature flight applications.
  • Outokumpu entered the aerospace additive manufacturing supply chain by delivering its first batches of stainless steel metal powders tailored for aviation needs.
  • Oerlikon achieved a milestone of producing over 25,000 3D-printed suppressors utilizing its proprietary MetcoAdd™ nickel powder technology.
  • HP introduced new metal additive manufacturing innovations and partnerships aimed at lowering costs and scaling adoption across automotive and industrial markets.
  • FormAlloy expanded its presence with a new Application Development Center focused on Directed Energy Deposition technologies, receiving industry recognition for its advancements.


Get Free Sample

At OG Analysis, we understand the importance of informed decision-making in today's dynamic business landscape. To help you experience the depth and quality of our market research reports, we offer complimentary samples tailored to your specific needs.

Start Now! Please fill the form below for your free sample.

Why Request a Free Sample?

Evaluate Our Expertise: Our reports are crafted by industry experts and seasoned analysts. Requesting a sample allows you to assess the depth of research and the caliber of insights we provide.

Tailored to Your Needs: Let us know your industry, market segment, or specific topic of interest. Our free samples are customized to ensure relevance to your business objectives.

Witness Actionable Insights: See firsthand how our reports go beyond data, offering actionable insights and strategic recommendations that can drive your business forward.

Embark on your journey towards strategic decision-making by requesting a free sample from OG Analysis. Experience the caliber of insights that can transform the way you approach your business challenges.

You can purchase individual sections of this report. Explore pricing options for specific sections.

FAQ's

The Global Metal Additive Manufacturing Market is estimated to generate USD 5.6 billion in revenue in 2024.

The Global Metal Additive Manufacturing Market is expected to grow at a Compound Annual Growth Rate (CAGR) of 16.6% during the forecast period from 2025 to 2032.

The Metal Additive Manufacturing Market is estimated to reach USD 19.1 billion by 2032.

License

$3950- 30%

$6450- 40%

$8450- 50%

$2850- 20%

Didn’t find what you’re looking for? TALK TO OUR ANALYST TEAM

Need something within your budget? NO WORRIES! WE GOT YOU COVERED!

Related Products

Ground Calcium Carbonate Market Outlook Report

Ground Calcium Carbonate Market Overview Ground calcium carbonate commonly referred to as GCC is finely ground limestone or marble, a calcium carbonate material having the chemical formula, CaCO3. GCC accounts for more than 80% of the Calcium carbonate market that is available in Ground Calcium Carbonate (GCC) and Precipitated Calcium Carbonate (PCC) forms. GCC is produced by mechanical grinding of the raw material, limestone, and then classified to the desired size without involving any chemical change in the process. In a magnified view, the distribution of particle sizes in a GCC is much broader than for a PCC of the same size, implying that there are many more large particles and many more small particles than in a PCC. The size of the largest of the particles (the ""top size"") is much greater for a GCC than for a PCC, thus making GCC a less refined version of Calcium carbonate. GCC is widely used as an industrial mineral is differentiated by three primary attributes - particle size, color and chemical purity. The mineral finds application in various industries based on its quality and suitability of use. Trade Intelligence forGround Calcium Carbonate Market Global Calcium carbonate Trade, Imports, USD million, 2020-24 2020 2021 2022 2023 2024 World 917 1,067 1,141 964 922 Germany 95.7 103 89.6 73.6 67.3 India 79.9 141 164 68.9 63.7 Saudi Arabia 33.8 37.9 35.8 29.5 39.2 Indonesia 31.5 37.9 44.1 40.5 38.4 United States of America 28.0 29.7 47.3 35.9 35.7 Source: OGAnalysis, International Trade Centre (ITC) - Germany, India, Saudi Arabia, Indonesia and United States of America are the top five countries importing 26.5% of global Calcium carbonate in 2024 - Global Calcium carbonate Imports increased by 0.5% between 2020 and 2024 - Germany accounts for 7.3% of global Calcium carbonate trade in 2024 - India accounts for 6.9% of global Calcium carbonate trade in 2024 - Saudi Arabia accounts for 4.3% of global Calcium carbonate trade in 2024 Global Calcium carbonate Export Prices, USD/Ton, 2020-24 Source: OGAnalysis Latest Trends in Ground Calcium Carbonate Market Growing Usage of Calcium Carbonate as Industrial Filler: Industrial filler has been the top and continuously growing application for calcium carbonate. Finely ground calcium carbonate is used as a filler in plastics, paints, and paper to improve aesthetics, and functionality and to save on filling costs. Calcium carbonate consumption as the filler has the potential to exceed calcium carbonate used as a dimension stone, in a few key markets. The most abundant sources of carbonate mineral fillers are the reserves of white marble. The most important attributes of carbonate fillers that decide their usefulness in industrial applications are particle size, brightness (whiteness), and chemical purity. Fillers were earlier used to substitute costlier materials in paint or polymers in rubbers or plastics. Currently, they are being used to add stiffness, color, opacity, or other required qualities to a product. Innovative technologies allowing the usage of GCC in new applications without altering the originality and functionality are aiding further penetration of GCC. Driving Factors Increase in Demand from the Construction and Infrastructure Sector: Robust development in construction and infrastructure activities across the world is generating demand for paints, coatings, adhesives, ceramics and various other polymers and concretes. These end-users are further deriving demand for ground calcium carbonate materials. Increasing Population, growing urbanization and fast-developing economies, especially in Asia and the Middle East, have led to growth in the need for infrastructure. Huge developments in infra projects and high-rise apartments necessitate lightweight and cost-effective options. Ground Calcium Carbonate is evolving robustly to match those requirements precisely. Market Challenges Environmental hazards of limestone mining: Limestone mining can disturb groundwater conditions. Limestone deposits frequently arise in association with karst, a landscape where limestone gradually dissolves underground. The deposits result in caves, sinkholes, and areas of rock ruptures that create underground drainage areas. Mining in karst can disturb natural aquifers and alter the flow of the underground water. Excavating operations often remove ground water to expose the mining site; this can decrease the level of the water table and alter water flows through rock formations. Streams and rivers can be changed when mines pump excess water from a limestone quarry into natural downstream channels. This increases the danger of flooding and any pollutants or alterations in water quality disturb the surface water. Report Scope Parameter Ground Calcium Carbonate market scope Detail Base Year 2024 Estimated Year 2025 Forecast Period 2026-2032 Market Size-Units USD million Market Splits Covered By form, By End-User Countries Covered North America (USA, Canada, Mexico) Europe (Germany, UK, France, Spain, Italy, Rest of Europe) Asia-Pacific (China, India, Japan, Australia, Rest of APAC) The Middle East and Africa (Middle East, Africa) South and Central America (Brazil, Argentina, Rest of SCA) Analysis Covered Latest Trends, Driving Factors, Challenges, Trade Analysis, Price Analysis, Supply-Chain Analysis, Competitive Landscape, Company Strategies Customization 10% free customization (up to 10 analyst hours) to modify segments, geographies, and companies analyzed Post-Sale Support 4 analyst hours, available up to 4 weeks Delivery Format The Latest Updated PDF and Excel Data file

Published:Feb-2025

TPU Filament Market Analysis and Outlook Report: Industry Size, Share, Growth Trends, and Forecast (2025-2034)

The TPU Filament Market is rapidly evolving as additive manufacturing gains widespread traction across sectors such as automotive, healthcare, sportswear, electronics, and industrial design. Thermoplastic polyurethane (TPU) filament is particularly prized for its flexibility, durability, and resistance to abrasion, making it an ideal choice for printing parts that require elasticity and mechanical performance. From wearable components and protective gear to seals, gaskets, and functional prototypes, TPU is becoming a go-to material in FDM (Fused Deposition Modeling) 3D printing. As the demand for customizable, on-demand, and lightweight components grows, industries are increasingly turning to TPU filament for producing complex geometries with enhanced tactile properties and chemical resistance, while also benefiting from shorter production lead times. Advancements in extrusion technology and material formulation are significantly enhancing the printability and consistency of TPU filaments. Key players are investing in R&D to develop high-flow variants, antimicrobial properties, and filaments with optimized surface finish and shore hardness. Asia-Pacific is emerging as a production and consumption hub due to its expanding electronics and automotive base, while North America and Europe remain strongholds of innovation and early adoption. Market competitiveness is intensifying with a mix of specialized filament producers and global polymer giants offering tailored grades of TPU to meet application-specific needs. Custom color matching, low-odor processing, and bio-based TPU innovations are also shaping strategic differentiation among manufacturers. Trade Intelligence-TPU Filament Market Global monofilaments, rods, sticks & profiles (>1 mm, excl. ethylene/vinyl chloride) , Imports, USD million, 2020-24 2020 2021 2022 2023 2024 World 2,126 2,646 2,802 2,627 2,639 United States of America 205 245 270 241 234 Germany 177 221 245 224 204 United Kingdom 93 84 127 113 125 France 114 148 168 147 123 Poland 91 116 124 108 118 Source: OGAnalysis, International Trade Centre (ITC) - United States of America , Germany , United Kingdom , France and Poland are the top five countries importing 30.5% of global monofilaments, rods, sticks & profiles (>1 mm, excl. ethylene/vinyl chloride) in 2024 - Global monofilaments, rods, sticks & profiles (>1 mm, excl. ethylene/vinyl chloride) Imports increased by 24.1% between 2020 and 2024 - United States of America accounts for 8.9% of global monofilaments, rods, sticks & profiles (>1 mm, excl. ethylene/vinyl chloride) trade in 2024 - Germany accounts for 7.7% of global monofilaments, rods, sticks & profiles (>1 mm, excl. ethylene/vinyl chloride) trade in 2024 - United Kingdom accounts for 4.7% of global monofilaments, rods, sticks & profiles (>1 mm, excl. ethylene/vinyl chloride) trade in 2024 Global monofilaments, rods, sticks & profiles (>1 mm, excl. ethylene/vinyl chloride) Export Prices, USD/Ton, 2020-24 Source: OGAnalysis, International Trade Centre (ITC) Key Takeaways – TPU Filament Market TPU filaments are increasingly used in consumer electronics, sportswear, and medical device prototyping due to their flexibility and strength. Rising adoption of desktop 3D printing in SMEs and educational institutions is contributing to the growing demand for easy-to-use TPU filament. Improved printability with dual extrusion compatibility and lower warping issues is broadening the user base for TPU filaments. Manufacturers are developing TPU filaments with enhanced chemical resistance for industrial applications like sealing, gasketing, and cable sheathing. Increased focus on sustainability is driving R&D in recyclable and bio-based TPU filament options for eco-conscious users. Asia-Pacific leads in manufacturing growth due to its cost-efficient production base and expanding end-use sectors. North America remains a top region for innovation, particularly in advanced medical devices, prosthetics, and sports gear using TPU filament. Limited compatibility of some TPU grades with entry-level 3D printers remains a challenge for widespread adoption in hobbyist markets. Price sensitivity and availability of low-cost alternatives can impact premium TPU filament adoption in cost-focused markets. Strategic alliances between filament manufacturers and 3D printer companies are helping standardize material-printer compatibility. Online distribution channels and DTC (direct-to-consumer) models are reshaping the filament supply landscape, offering more customization options. Demand for TPU filament with antibacterial and flame-retardant properties is rising in healthcare and industrial applications. Color variety, matte finish options, and flexible shore hardness grades are becoming key differentiators in a competitive landscape. Growth in e-commerce and DIY printing is supporting demand for packaged TPU filaments designed for user convenience and easy storage. Supply chain disruptions and fluctuations in TPU resin prices occasionally affect lead times and pricing consistency for filament manufacturers. Report Scope Parameter TPU Filament Market scope Detail Base Year 2024 Estimated Year 2025 Forecast Period 2026-2032 Market Size-Units USD billion Market Splits Covered By Product Type, By Application, By End User, By Technology, and By Distribution Channel Countries Covered North America (USA, Canada, Mexico) Europe (Germany, UK, France, Spain, Italy, Rest of Europe) Asia-Pacific (China, India, Japan, Australia, Rest of APAC) The Middle East and Africa (Middle East, Africa) South and Central America (Brazil, Argentina, Rest of SCA) Analysis Covered Latest Trends, Driving Factors, Challenges, Trade Analysis, Price Analysis, Supply-Chain Analysis, Competitive Landscape, Company Strategies Customization 10% free customization (up to 10 analyst hours) to modify segments, geographies, and companies analyzed Post-Sale Support 4 analyst hours, available up to 4 weeks Delivery Format The Latest Updated PDF and Excel Data file

Published:May-2025

HVAF Coating Materials Market Analysis and Outlook Report: Industry Size, Share, Growth Trends, and Forecast (2025-2034)

High Velocity Air Fuel (HVAF) coating materials are emerging as a preferred solution in industries requiring durable surface treatments for critical components. These materials are applied using HVAF thermal spray technology, which combines high particle velocity with lower flame temperatures, resulting in dense, hard coatings with minimal oxidation. Commonly used in aerospace, oil & gas, energy, and manufacturing, HVAF coatings extend component life, reduce downtime, and offer exceptional corrosion and wear resistance. Key materials include tungsten carbide, chromium carbide, and various metal alloys, each selected based on the application’s environmental demands. The growing focus on improving operational efficiency and reducing maintenance costs in high-value equipment is driving the adoption of HVAF coating systems. With regulatory pressure increasing on sustainability and lifecycle performance, HVAF coatings are positioned as an environmentally responsible alternative to hard chrome and other toxic legacy coatings. In 2024, the HVAF coating materials market saw increased traction across aerospace and power generation sectors. OEMs and MRO providers expanded the use of HVAF coatings for turbine blades, landing gear components, and pump housings due to their excellent adhesion, thermal resistance, and wear properties. Companies introduced new hybrid HVAF-HVOF systems to offer greater flexibility in coating operations. Additionally, material suppliers focused on developing finer carbide powders and custom alloy blends to meet application-specific demands. Environmental compliance also took center stage as more end-users moved away from hard chrome due to REACH regulations in Europe and similar policies in North America. Contract coating service providers upgraded their HVAF spray booths with automation and real-time quality monitoring to improve throughput and consistency. Several collaborative R&D projects between coating equipment manufacturers and academic institutions also resulted in prototype materials with improved microstructure and bond strength. Looking ahead to 2025 and beyond, the HVAF coating materials market is expected to evolve further with advancements in process control, material customization, and digital integration. AI and machine learning will play a greater role in optimizing spray parameters, predicting coating performance, and enabling closed-loop process adjustments. The expansion of hydrogen and renewable energy sectors will boost demand for high-durability coatings to protect components operating under extreme thermal and corrosive conditions. Additive manufacturing and component repair will open new frontiers for HVAF-compatible coatings that can be applied to complex geometries with minimal heat impact. Emerging economies in Asia and Latin America are likely to invest in HVAF coating capabilities as they scale up industrial production and seek to reduce imports of wear-prone components. Furthermore, sustainability goals will push manufacturers to develop coatings that are recyclable or have lower embedded carbon, reinforcing HVAF's role in next-generation surface engineering strategies. Trade Intelligence Ofhvaf coating materials market Global Other carbides (excl. Ca, Si, inorganic salts), Imports, USD million, 2020-24 2020 2021 2022 2023 2024 World 565 915 1036 841 831 United States of America 102 159 203 156 149 Germany 97 140 139 122 123 Japan 70 132 146 116 105 Sweden 56 106 116 86 93 Korea, Republic of 42 78 79 71 77 Source: OGAnalysis, (ITC) - United States of America, Germany, Japan, Sweden and Korea, Republic of are the top five countries importing 65.9% of global Other carbides (excl. Ca, Si, inorganic salts) in 2024 - Global Other carbides (excl. Ca, Si, inorganic salts) Imports increased by 46.9% between 2020 and 2024 - United States of America accounts for 18% of global Other carbides (excl. Ca, Si, inorganic salts) trade in 2024 - Germany accounts for 14.8% of global Other carbides (excl. Ca, Si, inorganic salts) trade in 2024 - Japan accounts for 12.6% of global Other carbides (excl. Ca, Si, inorganic salts) trade in 2024 Global Other carbides (excl. Ca, Si, inorganic salts) Export Prices, USD/Ton, 2020-24 Source: OGAnalysis Key Market Trends, Drivers and Challenges Hybrid thermal spray technologies combining HVAF and HVOF capabilities are becoming popular for enabling coating versatility, especially in aerospace and heavy machinery sectors where different surface properties are required across a single component. Increased adoption of eco-friendly HVAF coatings to replace hard chrome and cadmium plating due to environmental and worker safety regulations, particularly in Europe and North America, is driving material innovation and demand. Customization of feedstock materials is on the rise, with powder manufacturers offering fine-grained carbides and tailored alloy compositions optimized for specific performance targets such as high temperature oxidation resistance and extreme abrasion. Growing need for wear and corrosion-resistant coatings in high-performance sectors like oil & gas, marine, and energy, where downtime costs are significant and reliability is paramount, is pushing demand for advanced HVAF materials. Stringent global regulations (e.g., REACH, OSHA) banning or restricting toxic surface treatments are forcing manufacturers to adopt safer alternatives, making HVAF coatings a compliance-friendly replacement with comparable or superior performance. Technological advancements in spray systems and coating robots that support precise, repeatable HVAF application are reducing operational complexity and enabling wider adoption across industrial manufacturing and repair shops. High initial capital investment for HVAF systems and the need for skilled operators can limit adoption, especially among small-to-mid-sized enterprises in emerging markets or low-margin manufacturing sectors. Limited standardization in HVAF feedstock powders and process parameters across different suppliers can create inconsistency in coating quality and hinder scalability in global supply chains. Report Scope Parameter hvaf coating materials Market scope Detail Base Year 2024 Estimated Year 2025 Forecast Period 2026-2032 Market Size-Units USD billion Market Splits Covered By Product, By Application, By End User and By Technology Countries Covered North America (USA, Canada, Mexico) Europe (Germany, UK, France, Spain, Italy, Rest of Europe) Asia-Pacific (China, India, Japan, Australia, Rest of APAC) The Middle East and Africa (Middle East, Africa) South and Central America (Brazil, Argentina, Rest of SCA) Analysis Covered Latest Trends, Driving Factors, Challenges, Trade Analysis, Price Analysis, Supply-Chain Analysis, Competitive Landscape, Company Strategies Customization 10% free customization (up to 10 analyst hours) to modify segments, geographies, and companies analyzed Post-Sale Support 4 analyst hours, available up to 4 weeks Delivery Format The Latest Updated PDF and Excel Data file

Published:Jun-2025