Global Nanocomposites Market Report Outlook Report: Latest Trends and Growth Opportunities by Region

Published On: Feb, 2025
|
Pages: 152

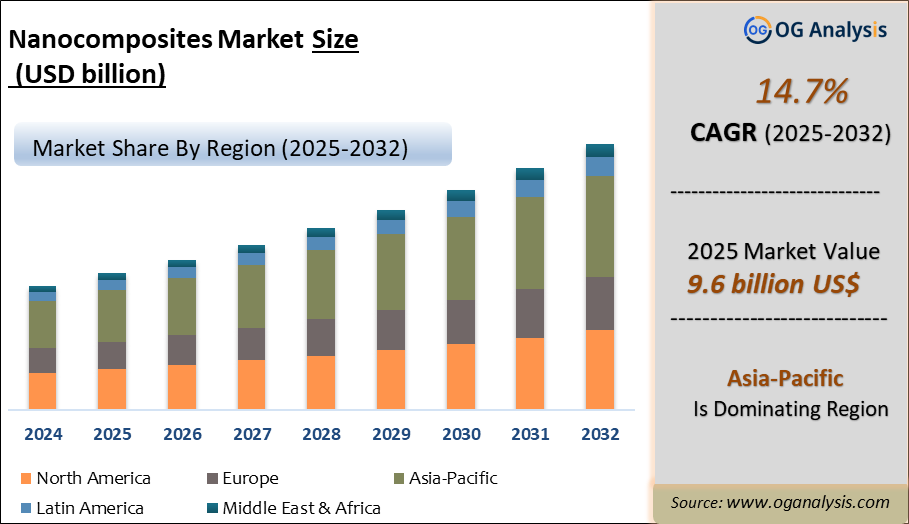
"The Global Nanocomposites Market Size was valued at USD 8.5 billion in 2024 and is projected to reach USD 9.6 billion in 2025. Worldwide sales of Nanocomposites are expected to grow at a significant CAGR of 14.7%, reaching USD 34.0 billion by the end of the forecast period in 2034."

Introduction and Overview

The nanocomposites market represents a dynamic and rapidly evolving sector within materials science. These advanced materials are composed of a matrix embedded with nanoparticles, which enhance their mechanical, thermal, and electrical properties compared to conventional composites. The market has seen significant growth driven by the increasing demand for high-performance materials across various industries, including automotive, aerospace, electronics, and healthcare. Innovations in nanotechnology have enabled the development of nanocomposites with tailored properties, making them highly desirable for applications requiring superior performance and efficiency. As industries continue to seek lightweight, durable, and multifunctional materials, nanocomposites are positioned to play a crucial role in meeting these demands.

In recent years, the nanocomposites market has been characterized by a surge in research and development activities, aimed at expanding the applications and improving the performance of these materials. The market is influenced by the growing emphasis on sustainability and environmental impact, leading to the development of eco-friendly nanocomposites. The integration of nanocomposites into various manufacturing processes has led to significant advancements in product quality and performance. Furthermore, the increasing adoption of nanocomposites in emerging technologies, such as renewable energy and smart materials, is driving market growth. Overall, the nanocomposites market is poised for substantial expansion, supported by technological advancements and the expanding scope of applications.

Nanocomposites Market Analysis 2025-2032: Industry Size, Share, Growth Trends, Competition and Forecast Report


Trade Intelligence for nanocomposites market

Global Non-cellular polyethylene plates, sheets, film, foil and strip (unworked, not reinforced or backed) Trade, Imports, USD million, 2020-24


2020

2021

2022

2023

2024

World

15,733

         19,730

         21,105

         18,778

         19,022

United States of America

           1,705

           2,173

           2,444

           2,168

           2,356

Germany

              940

           1,279

           1,373

           1,137

           1,142

France

              793

           1,058

           1,182

              994

              987

Mexico

              585

              698

              767

              697

              766

United Kingdom

              549

              566

              778

              735

              748

Source: OGAnalysis, International Trade Centre (ITC)

- United States of America, Germany, France, Mexico and United Kingdom are the top five countries importing 31.5% of global Non-cellular polyethylene plates, sheets, film, foil and strip (unworked, not reinforced or backed) in 2024
- Global Non-cellular polyethylene plates, sheets, film, foil and strip (unworked, not reinforced or backed) Imports increased by 20.9% between 2020 and 2024
- United States of America accounts for 12.4% of global Non-cellular polyethylene plates, sheets, film, foil and strip (unworked, not reinforced or backed) trade in 2024
- Germany accounts for 6% of global Non-cellular polyethylene plates, sheets, film, foil and strip (unworked, not reinforced or backed) trade in 2024
- France accounts for 5.2% of global Non-cellular polyethylene plates, sheets, film, foil and strip (unworked, not reinforced or backed) trade in 2024

Global Non-cellular polyethylene plates, sheets, film, foil and strip (unworked, not reinforced or backed) Export Prices, USD/Ton, 2020-24

Source: OGAnalysis


Latest Trends

One of the most notable trends in the nanocomposites market is the rise of sustainable and eco-friendly materials. As industries and consumers become more environmentally conscious, there is a growing demand for nanocomposites that minimize environmental impact. Researchers are focusing on developing nanocomposites from renewable resources and improving their recyclability. For instance, bio-based nanocomposites are gaining traction due to their potential to reduce the reliance on fossil fuels and lower carbon emissions. This trend reflects a broader shift towards sustainability in materials science, aligning with global environmental goals and regulations.

Another key trend is the increasing integration of nanocomposites into electronics and smart technologies. The advancement of nanotechnology has led to the development of nanocomposites with exceptional electrical and thermal conductivity, making them ideal for applications in electronic devices, sensors, and energy storage systems. This includes the use of nanocomposites in flexible electronics and advanced battery technologies, which are pivotal for the growth of wearable electronics and electric vehicles. The continuous innovation in this area is driving the market forward and opening up new opportunities for nanocomposites in high-tech applications.

The expansion of nanocomposites in the healthcare sector is also a significant trend. Nanocomposites are being utilized in various medical applications, including drug delivery systems, tissue engineering, and diagnostic tools. Their unique properties, such as enhanced biocompatibility and targeted delivery capabilities, are making them increasingly valuable in improving patient outcomes and advancing medical technologies. This trend is supported by ongoing research and clinical trials demonstrating the potential of nanocomposites to revolutionize healthcare practices. As the demand for advanced medical solutions grows, the adoption of nanocomposites in this sector is expected to rise accordingly.

Drivers

The primary driver of the nanocomposites market is the demand for high-performance materials with enhanced properties. Nanocomposites offer superior mechanical strength, thermal stability, and electrical conductivity compared to traditional composites, making them highly sought after in various industries. The automotive and aerospace sectors, in particular, are leveraging these advanced materials to achieve lighter, stronger, and more efficient components, which contribute to improved fuel efficiency and overall performance. As these industries continue to push for technological advancements, the demand for nanocomposites is expected to grow accordingly.

Technological advancements in nanotechnology are another major driver of the market. The continuous development of new nanomaterials and manufacturing techniques has expanded the potential applications of nanocomposites. Innovations such as improved synthesis methods and the ability to tailor nanocomposite properties to specific needs are driving market growth. Additionally, advancements in characterization techniques allow for better understanding and optimization of nanocomposites, further enhancing their performance and applicability. These technological advancements are crucial in meeting the evolving demands of various industries and fostering market expansion.

The growing emphasis on sustainability and environmental impact is also driving the nanocomposites market. Industries are increasingly seeking materials that offer environmental benefits, such as reduced carbon footprint and improved recyclability. Nanocomposites that are derived from renewable resources or contribute to energy efficiency are gaining traction. For example, nanocomposites used in energy storage and conversion technologies can enhance the efficiency of renewable energy systems. As regulatory pressures and consumer preferences shift towards more sustainable solutions, the demand for eco-friendly nanocomposites is expected to rise, driving market growth.

Market Challenges

Despite its growth prospects, the nanocomposites market faces several challenges. One of the primary challenges is the high cost of production. The manufacturing processes involved in producing nanocomposites can be complex and expensive, which can limit their accessibility and adoption in some industries. Additionally, there are concerns regarding the scalability of nanocomposite production, as transitioning from laboratory-scale to industrial-scale production can be challenging. Moreover, regulatory and safety issues related to the use of nanomaterials pose significant hurdles. Ensuring the safe handling, use, and disposal of nanocomposites is crucial to address potential health and environmental risks. Overcoming these challenges is essential for the continued growth and widespread adoption of nanocomposites across various sectors.

Market Players

1. Sigma-Aldrich Co. LLC.
2. InMat Inc.
3. Inframat Corporation
4. Hybrid Plastics Inc.
5. Nanocor Incorporated
6. Foster Corporation
7. BYK-Gardner GmbH
8. Industrial Nanotech, Inc.

Report Scope

Parameter

nanocomposites market scope Detail

Base Year

2024

Estimated Year

2025

Forecast Period

2026-2032

Market Size-Units

USD Billion

Market Splits Covered

By Type, By Dimension, By Application

Countries Covered

North America (USA, Canada, Mexico)
Europe (Germany, UK, France, Spain, Italy, Rest of Europe)
Asia-Pacific (China, India, Japan, Australia, Rest of APAC)
The Middle East and Africa (Middle East, Africa)
South and Central America (Brazil, Argentina, Rest of SCA)

Analysis Covered

Latest Trends, Driving Factors, Challenges, Trade Analysis, Price Analysis, Supply-Chain Analysis, Competitive Landscape, Company Strategies

Customization

10% free customization (up to 10 analyst hours) to modify segments, geographies, and companies analyzed

Post-Sale Support

4 analyst hours, available up to 4 weeks

Delivery Format

The Latest Updated PDF and Excel Data file

Market Segmentation

  • By Type
  • Clay-based Nanocomposites
  • Carbon Nanotube
  • Metal Oxide
  • Nanofiber
  • Graphene
  • Others
  • By Dimension
  • 01-10 nm
  • 11-20 nm
  • 21-30 nm
  • 31-40 nm
  • 41-50 nm
  • By Application
  • Building and Construction
  • Electronics and Semiconductor
  • Automotive
  • Aviation
  • Medical and Healthcare
  • Plastics and Packaging
  • Energy
  • Military and Defense
  • Others (such as consumer goods)
  • By Geography
  • North America (USA, Canada, Mexico)
  • Europe (Germany, UK, France, Spain, Italy, Rest of Europe)
  • Asia-Pacific (China, India, Japan, Australia, Rest of APAC)
  • The Middle East and Africa (Middle East, Africa)
  • South and Central America (Brazil, Argentina, Rest of SCA)

Recent Developments

  • Toray Industries introduced a new nanocomposite combining carbon fiber with nano-silica to enhance durability for next-generation aircraft components.
  • DuPont launched a series of nanocomposite polymers designed for lightweighting in electric vehicles and aerospace applications.
  • Mitsubishi Chemical developed advanced nanocomposite packaging films aimed at extending shelf life for food and pharmaceutical products.
  • MCAP completed the acquisition of J-Film from Mitsubishi Chemical to expand its portfolio in advanced plastic and barrier film nanocomposites.
  • BASF unveiled a new nanoclay-based polymer composite targeting improved flame resistance and thermal stability for electronics housings.
  • LG Chem introduced graphene-reinforced nanocomposites to improve mechanical strength and conductivity for energy storage systems.
  • Arkema announced the commercialization of bio-based nanocomposites for use in sustainable automotive interior parts.


Get Free Sample

At OG Analysis, we understand the importance of informed decision-making in today's dynamic business landscape. To help you experience the depth and quality of our market research reports, we offer complimentary samples tailored to your specific needs.

Start Now! Please fill the form below for your free sample.

Why Request a Free Sample?

Evaluate Our Expertise: Our reports are crafted by industry experts and seasoned analysts. Requesting a sample allows you to assess the depth of research and the caliber of insights we provide.

Tailored to Your Needs: Let us know your industry, market segment, or specific topic of interest. Our free samples are customized to ensure relevance to your business objectives.

Witness Actionable Insights: See firsthand how our reports go beyond data, offering actionable insights and strategic recommendations that can drive your business forward.

Embark on your journey towards strategic decision-making by requesting a free sample from OG Analysis. Experience the caliber of insights that can transform the way you approach your business challenges.

You can purchase individual sections of this report. Explore pricing options for specific sections.

FAQ's

The Global Nanocomposites Market is estimated to generate USD 8.5 billion in revenue in 2024.

The Global Nanocomposites Market is expected to grow at a Compound Annual Growth Rate (CAGR) of 14.7% during the forecast period from 2025 to 2032.

The Nanocomposites Market is estimated to reach USD 25.5 billion by 2032.

License

$3950- 30%

$6450- 40%

$8450- 50%

$2850- 20%

Didn’t find what you’re looking for? TALK TO OUR ANALYST TEAM

Need something within your budget? NO WORRIES! WE GOT YOU COVERED!

Related Products

Ground Calcium Carbonate Market Outlook Report

Ground Calcium Carbonate Market Overview Ground calcium carbonate commonly referred to as GCC is finely ground limestone or marble, a calcium carbonate material having the chemical formula, CaCO3. GCC accounts for more than 80% of the Calcium carbonate market that is available in Ground Calcium Carbonate (GCC) and Precipitated Calcium Carbonate (PCC) forms. GCC is produced by mechanical grinding of the raw material, limestone, and then classified to the desired size without involving any chemical change in the process. In a magnified view, the distribution of particle sizes in a GCC is much broader than for a PCC of the same size, implying that there are many more large particles and many more small particles than in a PCC. The size of the largest of the particles (the ""top size"") is much greater for a GCC than for a PCC, thus making GCC a less refined version of Calcium carbonate. GCC is widely used as an industrial mineral is differentiated by three primary attributes - particle size, color and chemical purity. The mineral finds application in various industries based on its quality and suitability of use. Trade Intelligence forGround Calcium Carbonate Market Global Calcium carbonate Trade, Imports, USD million, 2020-24 2020 2021 2022 2023 2024 World 917 1,067 1,141 964 922 Germany 95.7 103 89.6 73.6 67.3 India 79.9 141 164 68.9 63.7 Saudi Arabia 33.8 37.9 35.8 29.5 39.2 Indonesia 31.5 37.9 44.1 40.5 38.4 United States of America 28.0 29.7 47.3 35.9 35.7 Source: OGAnalysis, International Trade Centre (ITC) - Germany, India, Saudi Arabia, Indonesia and United States of America are the top five countries importing 26.5% of global Calcium carbonate in 2024 - Global Calcium carbonate Imports increased by 0.5% between 2020 and 2024 - Germany accounts for 7.3% of global Calcium carbonate trade in 2024 - India accounts for 6.9% of global Calcium carbonate trade in 2024 - Saudi Arabia accounts for 4.3% of global Calcium carbonate trade in 2024 Global Calcium carbonate Export Prices, USD/Ton, 2020-24 Source: OGAnalysis Latest Trends in Ground Calcium Carbonate Market Growing Usage of Calcium Carbonate as Industrial Filler: Industrial filler has been the top and continuously growing application for calcium carbonate. Finely ground calcium carbonate is used as a filler in plastics, paints, and paper to improve aesthetics, and functionality and to save on filling costs. Calcium carbonate consumption as the filler has the potential to exceed calcium carbonate used as a dimension stone, in a few key markets. The most abundant sources of carbonate mineral fillers are the reserves of white marble. The most important attributes of carbonate fillers that decide their usefulness in industrial applications are particle size, brightness (whiteness), and chemical purity. Fillers were earlier used to substitute costlier materials in paint or polymers in rubbers or plastics. Currently, they are being used to add stiffness, color, opacity, or other required qualities to a product. Innovative technologies allowing the usage of GCC in new applications without altering the originality and functionality are aiding further penetration of GCC. Driving Factors Increase in Demand from the Construction and Infrastructure Sector: Robust development in construction and infrastructure activities across the world is generating demand for paints, coatings, adhesives, ceramics and various other polymers and concretes. These end-users are further deriving demand for ground calcium carbonate materials. Increasing Population, growing urbanization and fast-developing economies, especially in Asia and the Middle East, have led to growth in the need for infrastructure. Huge developments in infra projects and high-rise apartments necessitate lightweight and cost-effective options. Ground Calcium Carbonate is evolving robustly to match those requirements precisely. Market Challenges Environmental hazards of limestone mining: Limestone mining can disturb groundwater conditions. Limestone deposits frequently arise in association with karst, a landscape where limestone gradually dissolves underground. The deposits result in caves, sinkholes, and areas of rock ruptures that create underground drainage areas. Mining in karst can disturb natural aquifers and alter the flow of the underground water. Excavating operations often remove ground water to expose the mining site; this can decrease the level of the water table and alter water flows through rock formations. Streams and rivers can be changed when mines pump excess water from a limestone quarry into natural downstream channels. This increases the danger of flooding and any pollutants or alterations in water quality disturb the surface water. Report Scope Parameter Ground Calcium Carbonate market scope Detail Base Year 2024 Estimated Year 2025 Forecast Period 2026-2032 Market Size-Units USD million Market Splits Covered By form, By End-User Countries Covered North America (USA, Canada, Mexico) Europe (Germany, UK, France, Spain, Italy, Rest of Europe) Asia-Pacific (China, India, Japan, Australia, Rest of APAC) The Middle East and Africa (Middle East, Africa) South and Central America (Brazil, Argentina, Rest of SCA) Analysis Covered Latest Trends, Driving Factors, Challenges, Trade Analysis, Price Analysis, Supply-Chain Analysis, Competitive Landscape, Company Strategies Customization 10% free customization (up to 10 analyst hours) to modify segments, geographies, and companies analyzed Post-Sale Support 4 analyst hours, available up to 4 weeks Delivery Format The Latest Updated PDF and Excel Data file

Published:Feb-2025

TPU Filament Market Analysis and Outlook Report: Industry Size, Share, Growth Trends, and Forecast (2025-2034)

The TPU Filament Market is rapidly evolving as additive manufacturing gains widespread traction across sectors such as automotive, healthcare, sportswear, electronics, and industrial design. Thermoplastic polyurethane (TPU) filament is particularly prized for its flexibility, durability, and resistance to abrasion, making it an ideal choice for printing parts that require elasticity and mechanical performance. From wearable components and protective gear to seals, gaskets, and functional prototypes, TPU is becoming a go-to material in FDM (Fused Deposition Modeling) 3D printing. As the demand for customizable, on-demand, and lightweight components grows, industries are increasingly turning to TPU filament for producing complex geometries with enhanced tactile properties and chemical resistance, while also benefiting from shorter production lead times. Advancements in extrusion technology and material formulation are significantly enhancing the printability and consistency of TPU filaments. Key players are investing in R&D to develop high-flow variants, antimicrobial properties, and filaments with optimized surface finish and shore hardness. Asia-Pacific is emerging as a production and consumption hub due to its expanding electronics and automotive base, while North America and Europe remain strongholds of innovation and early adoption. Market competitiveness is intensifying with a mix of specialized filament producers and global polymer giants offering tailored grades of TPU to meet application-specific needs. Custom color matching, low-odor processing, and bio-based TPU innovations are also shaping strategic differentiation among manufacturers. Trade Intelligence-TPU Filament Market Global monofilaments, rods, sticks & profiles (>1 mm, excl. ethylene/vinyl chloride) , Imports, USD million, 2020-24 2020 2021 2022 2023 2024 World 2,126 2,646 2,802 2,627 2,639 United States of America 205 245 270 241 234 Germany 177 221 245 224 204 United Kingdom 93 84 127 113 125 France 114 148 168 147 123 Poland 91 116 124 108 118 Source: OGAnalysis, International Trade Centre (ITC) - United States of America , Germany , United Kingdom , France and Poland are the top five countries importing 30.5% of global monofilaments, rods, sticks & profiles (>1 mm, excl. ethylene/vinyl chloride) in 2024 - Global monofilaments, rods, sticks & profiles (>1 mm, excl. ethylene/vinyl chloride) Imports increased by 24.1% between 2020 and 2024 - United States of America accounts for 8.9% of global monofilaments, rods, sticks & profiles (>1 mm, excl. ethylene/vinyl chloride) trade in 2024 - Germany accounts for 7.7% of global monofilaments, rods, sticks & profiles (>1 mm, excl. ethylene/vinyl chloride) trade in 2024 - United Kingdom accounts for 4.7% of global monofilaments, rods, sticks & profiles (>1 mm, excl. ethylene/vinyl chloride) trade in 2024 Global monofilaments, rods, sticks & profiles (>1 mm, excl. ethylene/vinyl chloride) Export Prices, USD/Ton, 2020-24 Source: OGAnalysis, International Trade Centre (ITC) Key Takeaways – TPU Filament Market TPU filaments are increasingly used in consumer electronics, sportswear, and medical device prototyping due to their flexibility and strength. Rising adoption of desktop 3D printing in SMEs and educational institutions is contributing to the growing demand for easy-to-use TPU filament. Improved printability with dual extrusion compatibility and lower warping issues is broadening the user base for TPU filaments. Manufacturers are developing TPU filaments with enhanced chemical resistance for industrial applications like sealing, gasketing, and cable sheathing. Increased focus on sustainability is driving R&D in recyclable and bio-based TPU filament options for eco-conscious users. Asia-Pacific leads in manufacturing growth due to its cost-efficient production base and expanding end-use sectors. North America remains a top region for innovation, particularly in advanced medical devices, prosthetics, and sports gear using TPU filament. Limited compatibility of some TPU grades with entry-level 3D printers remains a challenge for widespread adoption in hobbyist markets. Price sensitivity and availability of low-cost alternatives can impact premium TPU filament adoption in cost-focused markets. Strategic alliances between filament manufacturers and 3D printer companies are helping standardize material-printer compatibility. Online distribution channels and DTC (direct-to-consumer) models are reshaping the filament supply landscape, offering more customization options. Demand for TPU filament with antibacterial and flame-retardant properties is rising in healthcare and industrial applications. Color variety, matte finish options, and flexible shore hardness grades are becoming key differentiators in a competitive landscape. Growth in e-commerce and DIY printing is supporting demand for packaged TPU filaments designed for user convenience and easy storage. Supply chain disruptions and fluctuations in TPU resin prices occasionally affect lead times and pricing consistency for filament manufacturers. Report Scope Parameter TPU Filament Market scope Detail Base Year 2024 Estimated Year 2025 Forecast Period 2026-2032 Market Size-Units USD billion Market Splits Covered By Product Type, By Application, By End User, By Technology, and By Distribution Channel Countries Covered North America (USA, Canada, Mexico) Europe (Germany, UK, France, Spain, Italy, Rest of Europe) Asia-Pacific (China, India, Japan, Australia, Rest of APAC) The Middle East and Africa (Middle East, Africa) South and Central America (Brazil, Argentina, Rest of SCA) Analysis Covered Latest Trends, Driving Factors, Challenges, Trade Analysis, Price Analysis, Supply-Chain Analysis, Competitive Landscape, Company Strategies Customization 10% free customization (up to 10 analyst hours) to modify segments, geographies, and companies analyzed Post-Sale Support 4 analyst hours, available up to 4 weeks Delivery Format The Latest Updated PDF and Excel Data file

Published:May-2025

HVAF Coating Materials Market Analysis and Outlook Report: Industry Size, Share, Growth Trends, and Forecast (2025-2034)

High Velocity Air Fuel (HVAF) coating materials are emerging as a preferred solution in industries requiring durable surface treatments for critical components. These materials are applied using HVAF thermal spray technology, which combines high particle velocity with lower flame temperatures, resulting in dense, hard coatings with minimal oxidation. Commonly used in aerospace, oil & gas, energy, and manufacturing, HVAF coatings extend component life, reduce downtime, and offer exceptional corrosion and wear resistance. Key materials include tungsten carbide, chromium carbide, and various metal alloys, each selected based on the application’s environmental demands. The growing focus on improving operational efficiency and reducing maintenance costs in high-value equipment is driving the adoption of HVAF coating systems. With regulatory pressure increasing on sustainability and lifecycle performance, HVAF coatings are positioned as an environmentally responsible alternative to hard chrome and other toxic legacy coatings. In 2024, the HVAF coating materials market saw increased traction across aerospace and power generation sectors. OEMs and MRO providers expanded the use of HVAF coatings for turbine blades, landing gear components, and pump housings due to their excellent adhesion, thermal resistance, and wear properties. Companies introduced new hybrid HVAF-HVOF systems to offer greater flexibility in coating operations. Additionally, material suppliers focused on developing finer carbide powders and custom alloy blends to meet application-specific demands. Environmental compliance also took center stage as more end-users moved away from hard chrome due to REACH regulations in Europe and similar policies in North America. Contract coating service providers upgraded their HVAF spray booths with automation and real-time quality monitoring to improve throughput and consistency. Several collaborative R&D projects between coating equipment manufacturers and academic institutions also resulted in prototype materials with improved microstructure and bond strength. Looking ahead to 2025 and beyond, the HVAF coating materials market is expected to evolve further with advancements in process control, material customization, and digital integration. AI and machine learning will play a greater role in optimizing spray parameters, predicting coating performance, and enabling closed-loop process adjustments. The expansion of hydrogen and renewable energy sectors will boost demand for high-durability coatings to protect components operating under extreme thermal and corrosive conditions. Additive manufacturing and component repair will open new frontiers for HVAF-compatible coatings that can be applied to complex geometries with minimal heat impact. Emerging economies in Asia and Latin America are likely to invest in HVAF coating capabilities as they scale up industrial production and seek to reduce imports of wear-prone components. Furthermore, sustainability goals will push manufacturers to develop coatings that are recyclable or have lower embedded carbon, reinforcing HVAF's role in next-generation surface engineering strategies. Trade Intelligence Ofhvaf coating materials market Global Other carbides (excl. Ca, Si, inorganic salts), Imports, USD million, 2020-24 2020 2021 2022 2023 2024 World 565 915 1036 841 831 United States of America 102 159 203 156 149 Germany 97 140 139 122 123 Japan 70 132 146 116 105 Sweden 56 106 116 86 93 Korea, Republic of 42 78 79 71 77 Source: OGAnalysis, (ITC) - United States of America, Germany, Japan, Sweden and Korea, Republic of are the top five countries importing 65.9% of global Other carbides (excl. Ca, Si, inorganic salts) in 2024 - Global Other carbides (excl. Ca, Si, inorganic salts) Imports increased by 46.9% between 2020 and 2024 - United States of America accounts for 18% of global Other carbides (excl. Ca, Si, inorganic salts) trade in 2024 - Germany accounts for 14.8% of global Other carbides (excl. Ca, Si, inorganic salts) trade in 2024 - Japan accounts for 12.6% of global Other carbides (excl. Ca, Si, inorganic salts) trade in 2024 Global Other carbides (excl. Ca, Si, inorganic salts) Export Prices, USD/Ton, 2020-24 Source: OGAnalysis Key Market Trends, Drivers and Challenges Hybrid thermal spray technologies combining HVAF and HVOF capabilities are becoming popular for enabling coating versatility, especially in aerospace and heavy machinery sectors where different surface properties are required across a single component. Increased adoption of eco-friendly HVAF coatings to replace hard chrome and cadmium plating due to environmental and worker safety regulations, particularly in Europe and North America, is driving material innovation and demand. Customization of feedstock materials is on the rise, with powder manufacturers offering fine-grained carbides and tailored alloy compositions optimized for specific performance targets such as high temperature oxidation resistance and extreme abrasion. Growing need for wear and corrosion-resistant coatings in high-performance sectors like oil & gas, marine, and energy, where downtime costs are significant and reliability is paramount, is pushing demand for advanced HVAF materials. Stringent global regulations (e.g., REACH, OSHA) banning or restricting toxic surface treatments are forcing manufacturers to adopt safer alternatives, making HVAF coatings a compliance-friendly replacement with comparable or superior performance. Technological advancements in spray systems and coating robots that support precise, repeatable HVAF application are reducing operational complexity and enabling wider adoption across industrial manufacturing and repair shops. High initial capital investment for HVAF systems and the need for skilled operators can limit adoption, especially among small-to-mid-sized enterprises in emerging markets or low-margin manufacturing sectors. Limited standardization in HVAF feedstock powders and process parameters across different suppliers can create inconsistency in coating quality and hinder scalability in global supply chains. Report Scope Parameter hvaf coating materials Market scope Detail Base Year 2024 Estimated Year 2025 Forecast Period 2026-2032 Market Size-Units USD billion Market Splits Covered By Product, By Application, By End User and By Technology Countries Covered North America (USA, Canada, Mexico) Europe (Germany, UK, France, Spain, Italy, Rest of Europe) Asia-Pacific (China, India, Japan, Australia, Rest of APAC) The Middle East and Africa (Middle East, Africa) South and Central America (Brazil, Argentina, Rest of SCA) Analysis Covered Latest Trends, Driving Factors, Challenges, Trade Analysis, Price Analysis, Supply-Chain Analysis, Competitive Landscape, Company Strategies Customization 10% free customization (up to 10 analyst hours) to modify segments, geographies, and companies analyzed Post-Sale Support 4 analyst hours, available up to 4 weeks Delivery Format The Latest Updated PDF and Excel Data file

Published:Jun-2025