Global N-butyric and isobutyric acid Market Outlook Report: Latest Trends and Growth Opportunities by Region

Published On: Feb, 2025
|
Pages: 152

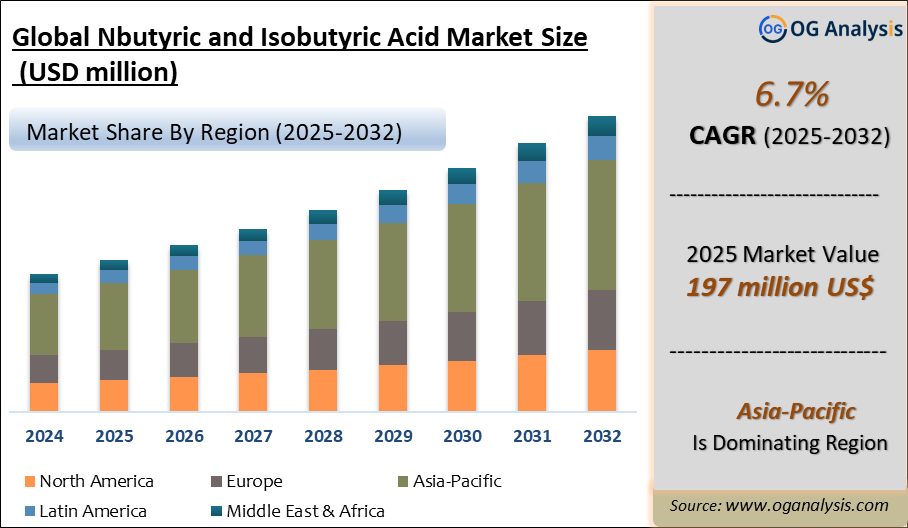
"The Global N-butyric and isobutyric acid Market Size was valued at USD 187 million in 2024 and is projected to reach USD 197 million in 2025. Worldwide sales of N-butyric and isobutyric acid are expected to grow at a significant CAGR of 6.7%, reaching USD 362 million by the end of the forecast period in 2034."

The N-butyric and isobutyric acid market is a dynamic segment within the chemical industry, driven by diverse applications across multiple sectors. N-butyric acid, a short-chain fatty acid with a distinctive odor, is widely utilized in the production of esters, which are used in flavorings, fragrances, and as intermediates in chemical syntheses. Isobutyric acid, with its branched-chain structure, finds applications primarily in the manufacture of polyisobutylene and as a raw material in various chemical processes. Both acids play critical roles in industrial applications, including pharmaceuticals, agriculture, and plastics, reflecting their significant demand and market relevance.

As industries continue to expand and innovate, the demand for N-butyric and isobutyric acids has seen a steady increase. The market is influenced by trends in consumer preferences, regulatory changes, and technological advancements in chemical production. These acids are crucial in sectors such as food and beverage, where they enhance flavor and aroma, and in the automotive industry, where they contribute to the synthesis of high-performance materials. The market's growth is supported by the continual need for specialty chemicals and the development of new applications, making it an area of active investment and research.

Global N-butyric And Isobutyric Acid Market Analysis 2025-2032: Industry Size, Share, Growth Trends, Competition and Forecast Report


Latest Trends

One of the key trends in the N-butyric and isobutyric acid market is the growing emphasis on sustainable and eco-friendly production processes. With increasing environmental concerns, manufacturers are investing in greener technologies that minimize waste and reduce carbon footprints. This shift is driven by both regulatory pressures and consumer demand for environmentally responsible products. Innovations in biotechnological methods and renewable resources are paving the way for more sustainable production, making these acids more attractive to eco-conscious industries.

Another notable trend is the rising demand for N-butyric acid in the pharmaceutical and healthcare sectors. N-butyric acid's potential therapeutic benefits, including its role in supporting gut health and its anti-inflammatory properties, are driving research and development activities. This increased focus on health and wellness is expanding the use of N-butyric acid beyond traditional applications, creating new opportunities for growth within the healthcare and nutraceutical markets.

The use of isobutyric acid in high-performance materials and polymers is also on the rise. Advances in polymer chemistry are enhancing the performance characteristics of materials derived from isobutyric acid, such as improved durability and resistance properties. This trend is particularly evident in the automotive and aerospace industries, where there is a constant demand for materials that offer superior performance and reliability. As these industries continue to evolve, the role of isobutyric acid in developing cutting-edge materials is becoming increasingly significant.

Drivers

Several factors are driving the growth of the N-butyric and isobutyric acid market. Firstly, the expanding food and beverage industry is a major driver, as these acids are used in flavorings and fragrances to enhance product appeal. The increasing consumption of processed foods and beverages, coupled with rising consumer preferences for natural and diverse flavors, fuels the demand for these acids. Additionally, the development of new food products and formulations that incorporate N-butyric and isobutyric acids further supports market growth.

Another significant driver is the ongoing advancement in chemical manufacturing technologies. Improvements in production efficiency and cost-effectiveness are making it easier for manufacturers to meet growing demand and explore new applications for these acids. Technological innovations, such as the development of catalysts and optimized reaction conditions, are enhancing the scalability and economic viability of producing N-butyric and isobutyric acids, thus contributing to market expansion.

The increasing focus on health and wellness is also boosting the demand for N-butyric acid in the nutraceutical and pharmaceutical industries. Research highlighting its potential health benefits, such as improving gut health and acting as an anti-inflammatory agent, is driving interest and investment in this sector. The expanding use of N-butyric acid in dietary supplements and therapeutic products reflects the broader trend of incorporating beneficial compounds into health-focused formulations.

Market Challenges

Despite the positive outlook for the N-butyric and isobutyric acid market, several challenges need to be addressed. One of the primary issues is the volatility in raw material prices, which can impact production costs and profit margins. Fluctuations in the availability and cost of feedstocks, such as petrochemical derivatives, can create uncertainty for manufacturers and affect market stability. Additionally, the need for continuous investment in research and development to keep pace with technological advancements and regulatory requirements can be a significant financial burden for companies operating in this sector. Addressing these challenges requires strategic planning and adaptation to ensure sustained growth and competitiveness in the market.

Market Players

1. Beijing Huamaoyuan Fragrance Flavor Co., Ltd.
2. Blue Marble Biomaterials
3. Eastman Chemical Company
4. Flavor Co., ltd., Inc.
5. Merck KGaA
6. OQ Chemicals GmbH
7. OXEA GmbH
8. Perstorp Holding AB
9. Shanghai Kayi Chemical Co., Ltd.
10. Snowco industrial Co., Ltd.
11. Thermo Fisher Scientific
12. Tokyo Chemical Industry Co., Ltd


Parameter

Detail

Base Year

2024

Estimated Year

2025

Forecast Period

2026-2032

Market Size-Units

USD million

Market Splits Covered

By Product, By Type, By Application

Countries Covered

North America (USA, Canada, Mexico)

Europe (Germany, UK, France, Spain, Italy, Rest of Europe)

Asia-Pacific (China, India, Japan, Australia, Rest of APAC)

The Middle East and Africa (Middle East, Africa)

South and Central America (Brazil, Argentina, Rest of SCA)

Analysis Covered

Latest Trends, Driving Factors, Challenges, Trade Analysis, Price Analysis, Supply-Chain Analysis, Competitive Landscape, Company Strategies

Customization

10% free customization (up to 10 analyst hours) to modify segments, geographies, and companies analyzed

Post-Sale Support

4 analyst hours, available up to 4 weeks

Delivery Format

The Latest Updated PDF and Excel Datafile

Market Segmentation

  • By Product
  • n-butyric acid
  • isobutyric acid
  • By Type
  • Synthetic
  • Renewable
  • By Application
  • Animal Feed
  • Chemical Intermediate
  • Food and Flavors
  • Pharmaceuticals
  • Perfumes
  • Others
  • By Geography
  • North America (USA, Canada, Mexico)
  • Europe (Germany, UK, France, Spain, Italy, Rest of Europe)
  • Asia-Pacific (China, India, Japan, Australia, Rest of APAC)
  • The Middle East and Africa (Middle East, Africa)
  • South and Central America (Brazil, Argentina, Rest of SCA)


Get Free Sample

At OG Analysis, we understand the importance of informed decision-making in today's dynamic business landscape. To help you experience the depth and quality of our market research reports, we offer complimentary samples tailored to your specific needs.

Start Now! Please fill the form below for your free sample.

Why Request a Free Sample?

Evaluate Our Expertise: Our reports are crafted by industry experts and seasoned analysts. Requesting a sample allows you to assess the depth of research and the caliber of insights we provide.

Tailored to Your Needs: Let us know your industry, market segment, or specific topic of interest. Our free samples are customized to ensure relevance to your business objectives.

Witness Actionable Insights: See firsthand how our reports go beyond data, offering actionable insights and strategic recommendations that can drive your business forward.

Embark on your journey towards strategic decision-making by requesting a free sample from OG Analysis. Experience the caliber of insights that can transform the way you approach your business challenges.

You can purchase individual sections of this report. Explore pricing options for specific sections.

FAQ's

The N-butyric and isobutyric acid Market is estimated to reach USD 314.2 million by 2032.

The Global N-butyric and isobutyric acid Market is expected to grow at a Compound Annual Growth Rate (CAGR) of 6.7% during the forecast period from 2025 to 2032.

The Global N-butyric and isobutyric acid Market is estimated to generate USD 187 million in revenue in 2024.

License

$3950- 5%

$6450- 10%

$8450- 15%

Didn’t find what you’re looking for? TALK TO OUR ANALYST TEAM

Need something within your budget? NO WORRIES! WE GOT YOU COVERED!

Related Products

Ground Calcium Carbonate Market Outlook Report

Ground Calcium Carbonate Market Overview Ground calcium carbonate commonly referred to as GCC is finely ground limestone or marble, a calcium carbonate material having the chemical formula, CaCO3. GCC accounts for more than 80% of the Calcium carbonate market that is available in Ground Calcium Carbonate (GCC) and Precipitated Calcium Carbonate (PCC) forms. GCC is produced by mechanical grinding of the raw material, limestone, and then classified to the desired size without involving any chemical change in the process. In a magnified view, the distribution of particle sizes in a GCC is much broader than for a PCC of the same size, implying that there are many more large particles and many more small particles than in a PCC. The size of the largest of the particles (the ""top size"") is much greater for a GCC than for a PCC, thus making GCC a less refined version of Calcium carbonate. GCC is widely used as an industrial mineral is differentiated by three primary attributes - particle size, color and chemical purity. The mineral finds application in various industries based on its quality and suitability of use. Latest Trends in Ground Calcium Carbonate Market Growing Usage of Calcium Carbonate as Industrial Filler: Industrial filler has been the top and continuously growing application for calcium carbonate. Finely ground calcium carbonate is used as a filler in plastics, paints, and paper to improve aesthetics, and functionality and to save on filling costs. Calcium carbonate consumption as the filler has the potential to exceed calcium carbonate used as a dimension stone, in a few key markets. The most abundant sources of carbonate mineral fillers are the reserves of white marble. The most important attributes of carbonate fillers that decide their usefulness in industrial applications are particle size, brightness (whiteness), and chemical purity. Fillers were earlier used to substitute costlier materials in paint or polymers in rubbers or plastics. Currently, they are being used to add stiffness, color, opacity, or other required qualities to a product. Innovative technologies allowing the usage of GCC in new applications without altering the originality and functionality are aiding further penetration of GCC. Driving Factors Increase in Demand from the Construction and Infrastructure Sector: Robust development in construction and infrastructure activities across the world is generating demand for paints, coatings, adhesives, ceramics and various other polymers and concretes. These end-users are further deriving demand for ground calcium carbonate materials. Increasing Population, growing urbanization and fast-developing economies, especially in Asia and the Middle East, have led to growth in the need for infrastructure. Huge developments in infra projects and high-rise apartments necessitate lightweight and cost-effective options. Ground Calcium Carbonate is evolving robustly to match those requirements precisely. Market Challenges Environmental hazards of limestone mining: Limestone mining can disturb groundwater conditions. Limestone deposits frequently arise in association with karst, a landscape where limestone gradually dissolves underground. The deposits result in caves, sinkholes, and areas of rock ruptures that create underground drainage areas. Mining in karst can disturb natural aquifers and alter the flow of the underground water. Excavating operations often remove ground water to expose the mining site; this can decrease the level of the water table and alter water flows through rock formations. Streams and rivers can be changed when mines pump excess water from a limestone quarry into natural downstream channels. This increases the danger of flooding and any pollutants or alterations in water quality disturb the surface water. Companies Mentioned J.M. Huber Corporation Mississippi Lime Company Imerys Omya AG Minerals Technologies Inc. Mississippi Lime Company Carmeuse Shiraishi Kogyo Kaisha, Ltd. Maruo Calcium Co. Ltd. Okutama Kogyo Co., Ltd. Newpark Resources, Inc. *The companies above are listed in no particular order. Report Scope Details Market Value- $ Million,2024 22,357 Market Growth (Value), (2024-2031)- % 5.83 Leading Region Xx Base Year 2023 Forecast Period 2024 to 2031 Segments Covered By Form, By End Use Geography Covered North America, Europe, Asia-Pacific, South and Central America, and Middle East & Africa

Published:Feb-2025

Plastic Caps and Closures Market Outlook Report

Plastic Caps and Closures technologies are systems and devices designed to capture, store, and release energy for later use. These technologies enable the storage of electrical, mechanical, thermal, or chemical energy in various forms, allowing for flexibility in energy supply and demand management. Plastic Caps and Closures technologies play a crucial role in enhancing the efficiency, reliability, and resilience of energy systems by mitigating the challenges posed by the intermittent nature of renewable energy sources, managing peak demand, and providing backup power during grid outages. The Plastic Caps and Closures technologies are categorized in to various types such as batteries, pumped hydro storage, thermal Plastic Caps and Closures, Compressed Air Plastic Caps and Closures (CAES), Flywheels and Supercapacitors. Plastic Caps and Closures solutions find applications across various industries, offering solutions to a wide range of challenges related to energy management, grid stability and sustainability. Some of the key end use industries for Plastic Caps and Closures technologies include Renewable Energy Integration, Electric Vehicles (EVs) and Transportation, Utilities and Grid-Scale Storage, Commercial and Industrial (C&I) Applications, Residential Plastic Caps and Closures, Telecommunications and Remote Applications and Defence and Aerospace. Latest Trends Advancements in Solar Plastic Caps and Closures Technologies: Solar energy plays an important role in the world's shift to renewable energy, increasing the demand for solar power storage systems. Solar power storage gives constant access to low-cost energy while also supporting the electric grid. However, the lack of adequate storage systems is projected to constitute a significant problem in reaching the full potential of solar energy. The solar business is experiencing tremendous technological developments that promise to improve solar energy efficiency and accessibility. Technologies such as Perovskite solar cells, bifacial modules, and sophisticated Plastic Caps and Closures technologies are making solar power more competitive as well as expanding its applicability in various sectors. In addition, in 2024, significant developments are expected in solar Plastic Caps and Closures, with enhanced battery technologies and innovative storage systems. The surge in demand for large-scale commercial and industrial Plastic Caps and Closures in 2024 is set to fuel substantial growth in the global Plastic Caps and Closures sector. Furthermore, advanced solar battery storage systems will complement higher-efficiency solar panels. Expansion of large-scale Plastic Caps and Closures: With an increasing trend of commercial and industrial storage system adoption, a major increase in global large-scale Plastic Caps and Closures system deployments is projected by 2024. In terms of installation growth, both domestic and international markets are expected to see an increase in demand. The installation of large-scale Plastic Caps and Closures is expected to exceed the installed capacity of domestic, commercial, and industrial Plastic Caps and Closures. The United States will be a significant demand centre for large-scale storage in 2024. The market is predicted to have a significant desire for Plastic Caps and Closures, driven by a highly efficient and diverse profitability model. However, the United States has a particular difficulty due to poor national grid connectivity, making the need for Plastic Caps and Closures even more essential. As the country's renewable energy potential grows, Plastic Caps and Closures will become increasingly important in maintaining a dependable and resilient grid. DrivingDrivers Increasing Adaption of Renewable Sources: One of the primary drivers of Plastic Caps and Closures market growth is the increasing adoption of renewable energy sources. Solar and wind power installations have proliferated worldwide, but their intermittent nature poses challenges to grid stability. Plastic Caps and Closures systems, including batteries, pumped hydro storage and thermal storage, help mitigate these challenges by storing excess energy during periods of high generation and releasing it when demand exceeds supply. According to the International Renewable Energy Agency (IRENA), the share of total installed renewable capacity in total installed capacity is anticipated to grow from 40% (or 3,382GW) in 2022 to 77% (or 11,174GW) by the end of 2030. Meanwhile, many nations around the world are planned to increase their respective renewable energy capacities in order to achieve complete net zero emissions by 2050. In the recent 18th Group of 20 Nations (G20) Summit held in India in September 2023, all the G20 nations have pledged to triple renewable energy capacity by 2030. Meanwhile, in the latest COP28 summit held in Dubai, around 120 nations including the US and the EU agreed to triple their renewables by 2030. Technological Advancements and R&D: Advancements in battery technologies, particularly lithium-ion batteries, have revolutionized the Plastic Caps and Closures landscape. Factors such as declining costs, improved energy density and enhanced performance characteristics have made batteries a preferred choice for various applications, including grid-scale storage, residential Plastic Caps and Closures and electric vehicles. Market Challenges Higher Costs: One of the significant barriers to the widespread adoption of Plastic Caps and Closures systems is their high initial costs. While the costs of Plastic Caps and Closures technologies, such as lithium-ion batteries, have been declining in recent years, they still represent a significant upfront investment for consumers, businesses, and utilities. The capital-intensive nature of Plastic Caps and Closures projects can deter potential buyers and limit deployment, particularly for grid-scale and large-scale applications. Technology Maturity and Reliability: Many Plastic Caps and Closures technologies like flow battery storage systems are still in the early stages of development, and their performance, reliability, and durability may not be fully proven or optimized. Issues such as battery degradation, cycle life, and safety concerns can impact the economic viability and operational performance of Plastic Caps and Closures systems. Lack of confidence in the reliability and long-term performance of Plastic Caps and Closures technologies can be a deterrent for potential buyers and investors. Companies Mentioned Silgan Holdings Inc. Berry Global Inc. Amcor plc Crown Holdings, Inc. AptarGroup, Inc. *The companies above are listed in no particular order. Report Scope Details Market Value- $ Billion,2024 49,504 Market Growth (Value), (2024-2031)- % 5.5 Leading Region Xx Base Year 2023 Forecast Period 2024 to 2031 Segments Covered By Product Type, By Raw Material, ByContainer Type, By End User Geography Covered North America, Europe, Asia-Pacific,South and Central America, and Middle East & Africa

Published:Jan-2025

Epoxy Film Adhesive Market Analysis and Outlook Report: Industry Size, Share, Growth Trends, and Forecast (2025-2034)

The Epoxy Film Adhesive Market is centered on high-performance bonding films composed of epoxy resins, curing agents, and additives laminated onto a carrier substrate. These adhesives are designed for precise application in demanding industries such as aerospace, automotive, electronics, wind energy, and industrial manufacturing. Epoxy film adhesives offer excellent mechanical strength, thermal resistance, and chemical durability, making them ideal for structural bonding, surface mounting, and insulation applications. Their popularity stems from consistent bonding thickness, minimal waste, and reliable bonding quality under high-stress environments. As industries focus on lightweighting, durability, and process efficiency, the demand for solvent-free, pre‑cast epoxy films has steadily increased. In the aerospace sector, epoxy film adhesives are extensively used for bonding composite airframe components, interior fixtures, and load-bearing structures, where reliable performance across a wide temperature range is critical. In electronics and electrical applications, they are used for insulation and attachment of transformers, motors, and power modules due to their dielectric properties. The automotive industry leverages epoxy film adhesives in electric vehicle battery packs, bonding glass roofs, sensor integration, and hybrid structural components—features that demand thermal stability and vibration resistance. Additionally, the wind energy sector uses these films to bond composite blades and tower sections, benefiting from their fatigue resistance and environmental durability. The market is driven by increasing automation, as manufacturers adopt pre‑cured adhesive films compatible with heat and pressure curing processes. Moreover, growing emphasis on eco-friendly, low‑VOC adhesives aligns with broader sustainability targets. Forecasts indicate that the epoxy film adhesive market will remain robust, supported by ongoing materials innovation, customization for specialized applications, and rising investment in high‑performance bonded assemblies across all industrial segments. Key Market Insights Epoxy film adhesives are increasingly preferred in aerospace manufacturing due to their superior strength-to-weight ratio, consistent bond thickness, and resistance to extreme environmental conditions, making them ideal for structural bonding of composite aircraft components. In the automotive sector, the demand for epoxy film adhesives is growing rapidly, especially in electric vehicle production where they are used for bonding battery cells, thermal management materials, and lightweight structural parts to improve durability and thermal stability. Electronics manufacturers are adopting epoxy film adhesives for assembling and insulating delicate components like sensors, circuit boards, and motors, leveraging the adhesives’ excellent dielectric strength, moisture resistance, and precise application properties. The market is benefiting from a shift toward automation and precision engineering, as film adhesives allow for pre-measured, mess-free application, reducing material waste and enabling faster and more consistent bonding in high-volume production settings. Wind energy applications are fueling demand for epoxy film adhesives, particularly for bonding rotor blades and structural assemblies in offshore and onshore turbines, where adhesives must withstand continuous stress and harsh weather exposure. Environmentally friendly formulations are gaining traction as regulations tighten around volatile organic compound (VOC) emissions, prompting manufacturers to develop solvent-free and low-emission epoxy film adhesives for sustainable manufacturing. Ongoing R&D is enhancing the performance of epoxy film adhesives by integrating nanomaterials and thermally conductive additives, enabling better mechanical properties, thermal dissipation, and longer service life in electronics and industrial systems. The Asia-Pacific region is emerging as a dominant market due to rapid industrialization, rising automotive and electronics production, and strategic investments in aerospace manufacturing hubs, particularly in China, South Korea, and India. Customized adhesive films designed for specific curing cycles, substrates, and mechanical demands are increasingly being used in niche applications like satellites, medical devices, and specialty electronics, supporting premium market segments. Supply chain stability and availability of raw materials like epoxy resins and specialty curing agents remain crucial, with major players investing in backward integration and regional manufacturing to mitigate disruptions and ensure consistent quality. MarketScope Parameter Detail Base Year 2024 Estimated Year 2025 Forecast Period 2026-2032 Market Size-Units USD billion Market Splits Covered By Product, By Application, By End User and By Technology Countries Covered North America (USA, Canada, Mexico) Europe (Germany, UK, France, Spain, Italy, Rest of Europe) Asia-Pacific (China, India, Japan, Australia, Rest of APAC) The Middle East and Africa (Middle East, Africa) South and Central America (Brazil, Argentina, Rest of SCA) Analysis Covered Latest Trends, Driving Factors, Challenges, Trade Analysis, Price Analysis, Supply-Chain Analysis, Competitive Landscape, Company Strategies Customization 10% free customization (up to 10 analyst hours) to modify segments, geographies, and companies analyzed Post-Sale Support 4 analyst hours, available up to 4 weeks Delivery Format The Latest Updated PDF and Excel Data file

Published:Jun-2025