Permanent Magnet Market Outlook report

Published On: Feb, 2025
|
Pages: 152

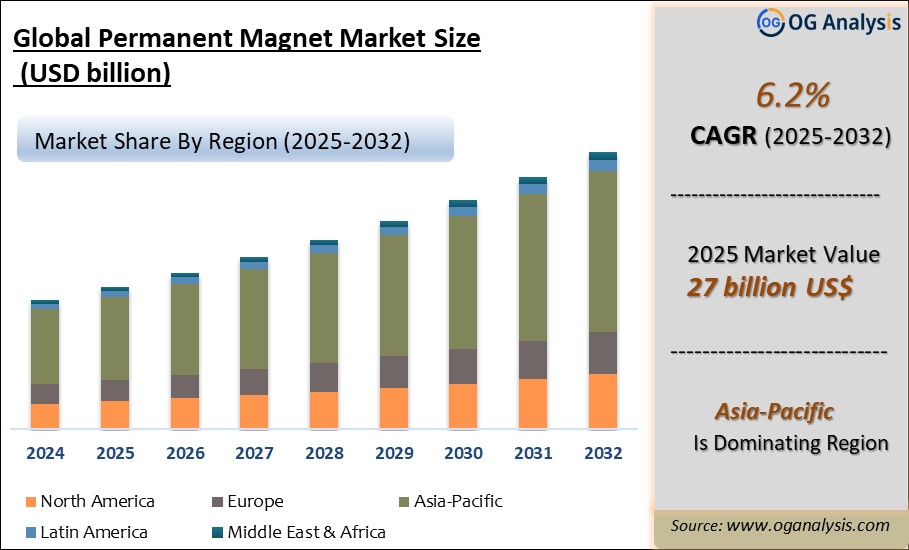
The Permanent Magnet Market is estimated at USD 25.4 billion in 2024. Further, the market is expected to grow from USD 27 billion in 2025 to USD 46.4 billion in 2034 at a CAGR of 6.2%.

Permanent Magnet Market Overview

Permanent magnets are a class of materials that exhibit a persistent magnetic field without the need for an external energy source. This magnetism stems from the alignment of electron spins within the material, leading to a macroscopic manifestation of magnetic properties. These materials are often characterized by their coercivity (the resistance to demagnetization), their remanence (the magnetic flux density that remains when the external field is removed), and their temperature stability. These characteristics determine the suitability of a particular type of permanent magnet in an application. Permanent magnets find an extensive array of applications across various industries, driven by their unique magnetic properties. They power the speakers and microphones in our electronic devices, enabling crisp sound reproduction. In electric motors and generators, permanent magnets generate the magnetic fields crucial for energy conversion and efficient propulsion. 
Renewable energy sources like wind turbines harness their magnetic prowess for electricity generation. In medical technology, permanent magnets are pivotal in magnetic resonance imaging (MRI) machines, facilitating non-invasive and high-resolution diagnostics. Additionally, they contribute to the automotive sector's electrification, propelling electric and hybrid vehicles with increased efficiency. From aerospace systems and navigation to consumer electronics and beyond, the diverse applications of permanent magnets underscore their essential role in modern technological advancements.

Global Permanent Magnet Market Analysis 2025-2032: Industry Size, Share, Growth Trends, Competition and Forecast Report


Trade Intelligence for Permanent Magnet Market

Global permanent magnets of metal and articles Trade, Imports, USD million, 2020-24


2020

2021

2022

2023

2024

World

           3,504

           5,146

           6,745

           5,850

           4,918

Germany

              406

              591

              867

              745

              598

Japan

              369

              557

              854

              769

              578

United States of America

              329

              508

              663

              558

              478

Mexico

              155

              226

              292

              309

              333

Viet Nam

              228

              297

              341

              283

              313

Source: OGAnalysis, International Trade Centre (ITC)

- Germany, Japan, United States of America, Mexico and Viet Nam are the top five countries importing 46.8% of global permanent magnets of metal and articles in 2024
- Global permanent magnets of metal and articles Imports increased by 40.3% between 2020 and 2024
- Germany accounts for 12.2% of global permanent magnets of metal and articles trade in 2024
- Japan accounts for 11.8% of global permanent magnets of metal and articles trade in 2024
- United States of America accounts for 9.7% of global permanent magnets of metal and articles trade in 2024

Global permanent magnets of metal and articles Export Prices, USD/Ton, 2020-24

Source: OGAnalysis


Latest Trends in the Permanent Magnet Market

Increasing Demand From The Automotive Industry: 
Permanent Magnets are widely used in the automobile industry, where they can be found in electric vehicle motors, hybrid vehicle motors, and fuel injection systems. With the growing demand for electric vehicles and the necessity for energy-efficient solutions, Permanent Magnet demand is likely to rise further. Key applications of Permanent Magnets in the automobile industry include - Electric motors: Permanent Magnets are used in electric motors in hybrid and electric vehicles. They are used to generate a magnetic field that rotates the motor's rotor, which in turn drives the vehicle.
Alternators and generators: Permanent Magnets are used in alternators and generators to produce an electromagnetic field that generates electricity. These devices are used to charge the battery and power the electrical systems in the vehicle. Magnetic sensors: Permanent Magnets are used in magnetic sensors that detect the position and speed of the vehicle's components, such as the wheels, crankshaft, and camshaft. This information is used to control the engine and transmission systems.

Driving Factors

Increasing demand for electric vehicles: 
With growing concern about environmental pollution and the need to cut carbon emissions, demand for electric vehicles (EVs) is rapidly expanding. Permanent Magnets are widely employed in EV motors, which is propelling the Permanent Magnet market forward. Permanent Magnets are widely utilized in electric vehicles (EVs) for a variety of purposes. A major application of Ferrite Magnets in EVs is the electric motors that power the vehicle. The magnets are used in the rotor of the motor, where they create a magnetic field that interacts with the stator to produce rotational motion. Permanent Magnets are popular for use in electric motors gaining from their low-cost and better magnetic properties.
Permanent Magnets are also used in the charging systems of EVs. The magnets are used in the charging cable, where they create a magnetic field that is used to transfer power wirelessly from the charging station to the EV. This wireless charging technology is becoming increasingly popular in the EV market, as it allows for convenient and efficient charging without the need for cables or plugs.

Market Challenges

Limited Availability of Raw Materials: 
The permanent magnet market faces a significant challenge in its reliance on specific raw materials, particularly rare-earth elements like neodymium, samarium, and cobalt. The supply chain for these materials is often concentrated in a handful of countries, posing geopolitical risks and vulnerability to disruptions. As these materials are vital for magnet manufacturing, any disruption in their supply can have far-reaching consequences, impacting industries ranging from renewable energy to electronics.
Another key concern is the competition for raw materials from other sectors. For example, strontium and barium are utilized in a variety of other items, including fireworks, glass manufacture, and medical uses. As demand for these items grows, the availability of raw materials for Permanent Magnet production may decrease, resulting in higher pricing and even shortages. However, Permanent Magnet makers are exploring options to diversify raw material sources, investing in recycling and waste reduction technologies, and creating alternative manufacturing procedures to use fewer raw materials or alternative materials. These efforts are expected to secure a consistent supply of raw materials for the future manufacturing of Permanent Magnets.

Companies Mentioned

TDK Corporation
PROTERIAL, Ltd. (Hitachi Metals Pvt. Ltd.)
DAIDO STEEL CO., LTD.
Adams Magnetic Products
JPMF Guangdong Co., Ltd
Arnold Magnetic Technologies

Report Scope

Parameter

 Permanent Magnet market scope Detail

Base Year

2024

Estimated Year

2025

Forecast Period

2026-2032

Market Size-Units

USD billion

Market Splits Covered

By material, By Ferrite Process, By Ferrite Type, and By End-User

Countries Covered

North America (USA, Canada, Mexico)
Europe (Germany, UK, France, Spain, Italy, Rest of Europe)
Asia-Pacific (China, India, Japan, Australia, Rest of APAC)
The Middle East and Africa (Middle East, Africa)
South and Central America (Brazil, Argentina, Rest of SCA)

Analysis Covered

Latest Trends, Driving Factors, Challenges, Trade Analysis, Price Analysis, Supply-Chain Analysis, Competitive Landscape, Company Strategies

Customization

10% free customization (up to 10 analyst hours) to modify segments, geographies, and companies analyzed

Post-Sale Support

4 analyst hours, available up to 4 weeks

Delivery Format

The Latest Updated PDF and Excel Data file

Market Segmentation


Market Split

    
     Detail

By Material

  • Neodymium-Iron-Boron
  • Ferrite
  • Samarium Cobalt
  • Alnico and Other

By Ferrite Process

  • Sintered Ferrite Magnet
  • Bonded Ferrite Magnet

By Ferrite Type

  • Hard Ferrite
  • Semi-Hard Ferrite
  • Soft Ferrite

By End-Use

  • Electronics & Appliances
  • Automotive
  • Industrial
  • Energy & Power
  • Medical
  • Other

By Geography

  • North America (USA, Canada, Mexico)
  • Europe (Germany, UK, France, Spain, Italy, Rest of Europe)
  • Asia-Pacific (China, India, Japan, Australia, Rest of APAC)
  • The Middle East and Africa (Middle East, Africa)
  • South and Central America (Brazil, Argentina, Rest of SCA)

Recent Developments 

  • Sept 2025: USA Rare Earth acquired UK firm LCM to accelerate its “mine-to-magnet” integration in rare earth metals and alloy production outside China.
  • Sept 2025: Energy Fuels announced its NdPr oxide (mined & processed in U.S.) has been qualified to be manufactured into permanent magnets for EV/hybrid drive motors.
  • Aug 2025: General Motors signed a multi-year supply agreement with Noveon Magnetics for domestically produced NdFeB magnets for its trucks/SUVs.
  • Jul 2025: MP Materials and Apple entered a long-term agreement for MP to supply recycled rare earth magnets produced in the U.S. for Apple’s products.
  • Jun 2025: Tata Motors disclosed that it is actively seeking alternative rare earth magnet suppliers in response to China’s export restrictions, while maintaining sufficient internal inventory.
  • Mar 2025: Korean researchers developed a grain boundary diffusion method enabling high-performance permanent magnets without heavy rare earth elements.

TABLE OF CONTENTS

1. GLOBAL PERMANENT MAGNET INDUSTRY
1.1. Market Scope and Definition
1.2. Study Assumptions

2. PERMANENT MAGNET MARKET LATEST TRENDS, DRIVERS AND CHALLENGES, 2023-2031
2.1. Permanent Magnet Market Latest Trends
2.1.1. Increasing Demand From The Automotive Industry:
2.1.2. Growing Adoption Of Renewable Energy Sources:
2.1.3. Technological Advancements In Ferrite Magnet Manufacturing:
2.1.4. Shift Towards Sustainable And Recyclable Permanent Magnets:
2.1.5. Increasing Use Of Permanent Magnets In Medical Equipment:
2.2. Permanent Magnet Market Insights, 2023-2031
2.2.1. Leading Permanent Magnet Material, 2023-2031
2.2.2. Top Permanent Magnet End-Use Industry, 2023-2031
2.2.3. Fast-Growing Geographies for Permanent Magnet, 2023-2031
2.3. Permanent Magnet Market Drivers to 2031
2.3.1. Increasing demand for electric vehicles:
2.3.2. Growing adoption of automation and robotics:
2.3.3. Rising demand for consumer electronics:
2.3.4. Wide temperature tolerance:
2.4. Permanent Magnet Market Restraints to 2031
2.4.1. Limited Availability of Raw Materials:
2.4.2. Environmental Impact and Sustainability:
2.4.3. Technological Transitions and Innovation of Alternate Sustainable Materials:
2.5. Permanent Magnet Market-Five Forces Analysis

3. GLOBAL PERMANENT MAGNET MARKET VALUE, MARKET SHARE, AND FORECAST TO 2031
3.1. Global Permanent Magnet Market Overview, 2023
3.2. Global Permanent Magnet Market Size and Share Outlook, By Material, 2023-2031
3.2.1. Neodymium-Iron-Boron
3.2.2. Ferrite
3.2.3. Samarium Cobalt
3.2.4. Alnico and Other
3.3. Global Permanent Magnet Market Size and Share Outlook, By End-Use Industry, 2023-2031
3.3.1. Electronics & Appliances
3.3.2. Automotive
3.3.3. Industrial
3.3.4. Energy & Power
3.3.5. Medical
3.3.6. Other End-Use Industry
3.4. Global Permanent Magnet Market Size and Share Outlook by Region, 2023-2031

4. NORTH AMERICA PERMANENT MAGNET MARKET VALUE, MARKET SHARE, AND FORECAST TO 2031
4.1. North America Permanent Magnet Market Overview, 2023
4.2. North America Permanent Magnet Market Size and Share Outlook by Material, 2023-2031
4.2.1. North America Ferrite Magnet Market Size and Share Outlook, By Process, 2023-2031
4.2.2. North America Ferrite Magnet Market Size and Share Outlook, By Product Type, 2023-2031
4.3. North America Permanent Magnet Market Size and Share Outlook by End-Use Industry, 2023-2031
4.4. North America Permanent Magnet Market Size and Share Outlook by Country, 2023-2031
4.4.1. United States
4.4.2. Canada
4.4.3. Mexico

5. EUROPE PERMANENT MAGNET MARKET VALUE, MARKET SHARE, AND FORECAST TO 2031
5.1. Europe Permanent Magnet Market Overview, 2023
5.2. Europe Permanent Magnet Market Size and Share Outlook by Material, 2023-2031
5.2.1. Europe Ferrite Magnet Market Size and Share Outlook, By Process, 2023-2031
5.2.2. Europe Ferrite Magnet Market Size and Share Outlook, By Product Type, 2023-2031
5.3. Europe Permanent Magnet Market Size and Share Outlook by End-Use Industry, 2023-2031
5.4. Europe Permanent Magnet Market Size and Share Outlook by Country, 2023-2031
5.4.1. Germany
5.4.2. UK
5.4.3. Italy
5.4.4. France
5.4.5. Spain
5.4.6. Rest of Europe

6. ASIA PACIFIC PERMANENT MAGNET MARKET VALUE, MARKET SHARE AND FORECAST TO 2031
6.1. Asia Pacific Permanent Magnet Market Overview, 2023
6.2. Asia Pacific Permanent Magnet Market Size and Share Outlook by Material, 2023-2031
6.2.1. Asia Pacific Ferrite Magnet Market Size and Share Outlook, By Process, 2023-2031
6.2.2. Asia Pacific Ferrite Magnet Market Size and Share Outlook, By Product Type, 2023-2031
6.3. Asia Pacific Permanent Magnet Market Size and Share Outlook by End-Use Industry, 2023-2031
6.4. Asia Pacific Permanent Magnet Market Size and Share Outlook by Country, 2023-2031
6.4.1. China
6.4.2. Japan
6.4.3. India
6.4.4. South Korea
6.4.5. Rest of Asia Pacific

7. SOUTH AND CENTRAL AMERICA PERMANENT MAGNET MARKET VALUE, MARKET SHARE AND FORECAST TO 2031
7.1. South and Central America Permanent Magnet Market Overview, 2023
7.2. South and Central America Permanent Magnet Market Size and Share Outlook by Material, 2023-2031
7.2.1. South and Central America Ferrite Magnet Market Size and Share Outlook, By Process, 2023-2031
7.2.2. South and Central America Ferrite Magnet Market Size and Share Outlook, By Product Type, 2023-2031
7.3. South and Central America Permanent Magnet Market Size and Share Outlook by End-Use Industry, 2023-2031
7.4. South and Central America Permanent Magnet Market Size and Share Outlook by Country, 2023-2031
7.4.1. Brazil
7.4.2. Argentina
7.4.3. Rest of South and Central America

8. MIDDLE EAST AFRICA PERMANENT MAGNET MARKET VALUE, MARKET SHARE AND FORECAST TO 2031
8.1. Middle East Africa Permanent Magnet Market Overview, 2023
8.2. Middle East Africa Permanent Magnet Market Size and Share Outlook by Material, 2023-2031
8.2.1. Middle East Africa Ferrite Magnet Market Size and Share Outlook, By Process, 2023-2031
8.2.2. Middle East Africa Ferrite Magnet Market Size and Share Outlook, By Product Type, 2023-2031
8.3. Middle East Africa Permanent Magnet Market Size and Share Outlook by End-Use Industry, 2023-2031
8.4. Middle East Africa Permanent Magnet Market Size and Share Outlook by Country, 2023-2031
8.4.1. Middle East
8.4.2. Africa

9. PERMANENT MAGNET MARKET STRUCTURE
9.1. TDK Corporation
9.2. PROTERIAL, Ltd. (Hitachi Metals Pvt. Ltd.)
9.3. DAIDO STEEL CO., LTD.
9.4. Adams Magnetic Products
9.5. JPMF Guangdong Co., Ltd
9.6. Arnold Magnetic Technologies

10. APPENDIX
10.1. Permanent Magnet Trade Data
10.2. About Us
10.3. Sources
10.4. Research Methodology
10.5. Contact Information


Get Free Sample

At OG Analysis, we understand the importance of informed decision-making in today's dynamic business landscape. To help you experience the depth and quality of our market research reports, we offer complimentary samples tailored to your specific needs.

Start Now! Please fill the form below for your free sample.

Why Request a Free Sample?

Evaluate Our Expertise: Our reports are crafted by industry experts and seasoned analysts. Requesting a sample allows you to assess the depth of research and the caliber of insights we provide.

Tailored to Your Needs: Let us know your industry, market segment, or specific topic of interest. Our free samples are customized to ensure relevance to your business objectives.

Witness Actionable Insights: See firsthand how our reports go beyond data, offering actionable insights and strategic recommendations that can drive your business forward.

Embark on your journey towards strategic decision-making by requesting a free sample from OG Analysis. Experience the caliber of insights that can transform the way you approach your business challenges.

You can purchase individual sections of this report. Explore pricing options for specific sections.
License

$4150- 30%

$6450- 40%

$8450- 50%

$2850- 20%

Didn’t find what you’re looking for? TALK TO OUR ANALYST TEAM

Need something within your budget? NO WORRIES! WE GOT YOU COVERED!

Related Products

Ground Calcium Carbonate Market Outlook Report

Ground Calcium Carbonate Market Overview Ground calcium carbonate commonly referred to as GCC is finely ground limestone or marble, a calcium carbonate material having the chemical formula, CaCO3. GCC accounts for more than 80% of the Calcium carbonate market that is available in Ground Calcium Carbonate (GCC) and Precipitated Calcium Carbonate (PCC) forms. GCC is produced by mechanical grinding of the raw material, limestone, and then classified to the desired size without involving any chemical change in the process. In a magnified view, the distribution of particle sizes in a GCC is much broader than for a PCC of the same size, implying that there are many more large particles and many more small particles than in a PCC. The size of the largest of the particles (the ""top size"") is much greater for a GCC than for a PCC, thus making GCC a less refined version of Calcium carbonate. GCC is widely used as an industrial mineral is differentiated by three primary attributes - particle size, color and chemical purity. The mineral finds application in various industries based on its quality and suitability of use. Trade Intelligence forGround Calcium Carbonate Market Global Calcium carbonate Trade, Imports, USD million, 2020-24 2020 2021 2022 2023 2024 World 917 1,067 1,141 964 922 Germany 95.7 103 89.6 73.6 67.3 India 79.9 141 164 68.9 63.7 Saudi Arabia 33.8 37.9 35.8 29.5 39.2 Indonesia 31.5 37.9 44.1 40.5 38.4 United States of America 28.0 29.7 47.3 35.9 35.7 Source: OGAnalysis, International Trade Centre (ITC) - Germany, India, Saudi Arabia, Indonesia and United States of America are the top five countries importing 26.5% of global Calcium carbonate in 2024 - Global Calcium carbonate Imports increased by 0.5% between 2020 and 2024 - Germany accounts for 7.3% of global Calcium carbonate trade in 2024 - India accounts for 6.9% of global Calcium carbonate trade in 2024 - Saudi Arabia accounts for 4.3% of global Calcium carbonate trade in 2024 Global Calcium carbonate Export Prices, USD/Ton, 2020-24 Source: OGAnalysis Latest Trends in Ground Calcium Carbonate Market Growing Usage of Calcium Carbonate as Industrial Filler: Industrial filler has been the top and continuously growing application for calcium carbonate. Finely ground calcium carbonate is used as a filler in plastics, paints, and paper to improve aesthetics, and functionality and to save on filling costs. Calcium carbonate consumption as the filler has the potential to exceed calcium carbonate used as a dimension stone, in a few key markets. The most abundant sources of carbonate mineral fillers are the reserves of white marble. The most important attributes of carbonate fillers that decide their usefulness in industrial applications are particle size, brightness (whiteness), and chemical purity. Fillers were earlier used to substitute costlier materials in paint or polymers in rubbers or plastics. Currently, they are being used to add stiffness, color, opacity, or other required qualities to a product. Innovative technologies allowing the usage of GCC in new applications without altering the originality and functionality are aiding further penetration of GCC. Driving Factors Increase in Demand from the Construction and Infrastructure Sector: Robust development in construction and infrastructure activities across the world is generating demand for paints, coatings, adhesives, ceramics and various other polymers and concretes. These end-users are further deriving demand for ground calcium carbonate materials. Increasing Population, growing urbanization and fast-developing economies, especially in Asia and the Middle East, have led to growth in the need for infrastructure. Huge developments in infra projects and high-rise apartments necessitate lightweight and cost-effective options. Ground Calcium Carbonate is evolving robustly to match those requirements precisely. Market Challenges Environmental hazards of limestone mining: Limestone mining can disturb groundwater conditions. Limestone deposits frequently arise in association with karst, a landscape where limestone gradually dissolves underground. The deposits result in caves, sinkholes, and areas of rock ruptures that create underground drainage areas. Mining in karst can disturb natural aquifers and alter the flow of the underground water. Excavating operations often remove ground water to expose the mining site; this can decrease the level of the water table and alter water flows through rock formations. Streams and rivers can be changed when mines pump excess water from a limestone quarry into natural downstream channels. This increases the danger of flooding and any pollutants or alterations in water quality disturb the surface water. Report Scope Parameter Ground Calcium Carbonate market scope Detail Base Year 2024 Estimated Year 2025 Forecast Period 2026-2032 Market Size-Units USD million Market Splits Covered By form, By End-User Countries Covered North America (USA, Canada, Mexico) Europe (Germany, UK, France, Spain, Italy, Rest of Europe) Asia-Pacific (China, India, Japan, Australia, Rest of APAC) The Middle East and Africa (Middle East, Africa) South and Central America (Brazil, Argentina, Rest of SCA) Analysis Covered Latest Trends, Driving Factors, Challenges, Trade Analysis, Price Analysis, Supply-Chain Analysis, Competitive Landscape, Company Strategies Customization 10% free customization (up to 10 analyst hours) to modify segments, geographies, and companies analyzed Post-Sale Support 4 analyst hours, available up to 4 weeks Delivery Format The Latest Updated PDF and Excel Data file

Published:Feb-2025

TPU Filament Market Analysis and Outlook Report: Industry Size, Share, Growth Trends, and Forecast (2025-2034)

The TPU Filament Market is rapidly evolving as additive manufacturing gains widespread traction across sectors such as automotive, healthcare, sportswear, electronics, and industrial design. Thermoplastic polyurethane (TPU) filament is particularly prized for its flexibility, durability, and resistance to abrasion, making it an ideal choice for printing parts that require elasticity and mechanical performance. From wearable components and protective gear to seals, gaskets, and functional prototypes, TPU is becoming a go-to material in FDM (Fused Deposition Modeling) 3D printing. As the demand for customizable, on-demand, and lightweight components grows, industries are increasingly turning to TPU filament for producing complex geometries with enhanced tactile properties and chemical resistance, while also benefiting from shorter production lead times. Advancements in extrusion technology and material formulation are significantly enhancing the printability and consistency of TPU filaments. Key players are investing in R&D to develop high-flow variants, antimicrobial properties, and filaments with optimized surface finish and shore hardness. Asia-Pacific is emerging as a production and consumption hub due to its expanding electronics and automotive base, while North America and Europe remain strongholds of innovation and early adoption. Market competitiveness is intensifying with a mix of specialized filament producers and global polymer giants offering tailored grades of TPU to meet application-specific needs. Custom color matching, low-odor processing, and bio-based TPU innovations are also shaping strategic differentiation among manufacturers. Trade Intelligence-TPU Filament Market Global monofilaments, rods, sticks & profiles (>1 mm, excl. ethylene/vinyl chloride) , Imports, USD million, 2020-24 2020 2021 2022 2023 2024 World 2,126 2,646 2,802 2,627 2,639 United States of America 205 245 270 241 234 Germany 177 221 245 224 204 United Kingdom 93 84 127 113 125 France 114 148 168 147 123 Poland 91 116 124 108 118 Source: OGAnalysis, International Trade Centre (ITC) - United States of America , Germany , United Kingdom , France and Poland are the top five countries importing 30.5% of global monofilaments, rods, sticks & profiles (>1 mm, excl. ethylene/vinyl chloride) in 2024 - Global monofilaments, rods, sticks & profiles (>1 mm, excl. ethylene/vinyl chloride) Imports increased by 24.1% between 2020 and 2024 - United States of America accounts for 8.9% of global monofilaments, rods, sticks & profiles (>1 mm, excl. ethylene/vinyl chloride) trade in 2024 - Germany accounts for 7.7% of global monofilaments, rods, sticks & profiles (>1 mm, excl. ethylene/vinyl chloride) trade in 2024 - United Kingdom accounts for 4.7% of global monofilaments, rods, sticks & profiles (>1 mm, excl. ethylene/vinyl chloride) trade in 2024 Global monofilaments, rods, sticks & profiles (>1 mm, excl. ethylene/vinyl chloride) Export Prices, USD/Ton, 2020-24 Source: OGAnalysis, International Trade Centre (ITC) Key Takeaways – TPU Filament Market TPU filaments are increasingly used in consumer electronics, sportswear, and medical device prototyping due to their flexibility and strength. Rising adoption of desktop 3D printing in SMEs and educational institutions is contributing to the growing demand for easy-to-use TPU filament. Improved printability with dual extrusion compatibility and lower warping issues is broadening the user base for TPU filaments. Manufacturers are developing TPU filaments with enhanced chemical resistance for industrial applications like sealing, gasketing, and cable sheathing. Increased focus on sustainability is driving R&D in recyclable and bio-based TPU filament options for eco-conscious users. Asia-Pacific leads in manufacturing growth due to its cost-efficient production base and expanding end-use sectors. North America remains a top region for innovation, particularly in advanced medical devices, prosthetics, and sports gear using TPU filament. Limited compatibility of some TPU grades with entry-level 3D printers remains a challenge for widespread adoption in hobbyist markets. Price sensitivity and availability of low-cost alternatives can impact premium TPU filament adoption in cost-focused markets. Strategic alliances between filament manufacturers and 3D printer companies are helping standardize material-printer compatibility. Online distribution channels and DTC (direct-to-consumer) models are reshaping the filament supply landscape, offering more customization options. Demand for TPU filament with antibacterial and flame-retardant properties is rising in healthcare and industrial applications. Color variety, matte finish options, and flexible shore hardness grades are becoming key differentiators in a competitive landscape. Growth in e-commerce and DIY printing is supporting demand for packaged TPU filaments designed for user convenience and easy storage. Supply chain disruptions and fluctuations in TPU resin prices occasionally affect lead times and pricing consistency for filament manufacturers. Report Scope Parameter TPU Filament Market scope Detail Base Year 2024 Estimated Year 2025 Forecast Period 2026-2032 Market Size-Units USD billion Market Splits Covered By Product Type, By Application, By End User, By Technology, and By Distribution Channel Countries Covered North America (USA, Canada, Mexico) Europe (Germany, UK, France, Spain, Italy, Rest of Europe) Asia-Pacific (China, India, Japan, Australia, Rest of APAC) The Middle East and Africa (Middle East, Africa) South and Central America (Brazil, Argentina, Rest of SCA) Analysis Covered Latest Trends, Driving Factors, Challenges, Trade Analysis, Price Analysis, Supply-Chain Analysis, Competitive Landscape, Company Strategies Customization 10% free customization (up to 10 analyst hours) to modify segments, geographies, and companies analyzed Post-Sale Support 4 analyst hours, available up to 4 weeks Delivery Format The Latest Updated PDF and Excel Data file

Published:May-2025

HVAF Coating Materials Market Analysis and Outlook Report: Industry Size, Share, Growth Trends, and Forecast (2025-2034)

High Velocity Air Fuel (HVAF) coating materials are emerging as a preferred solution in industries requiring durable surface treatments for critical components. These materials are applied using HVAF thermal spray technology, which combines high particle velocity with lower flame temperatures, resulting in dense, hard coatings with minimal oxidation. Commonly used in aerospace, oil & gas, energy, and manufacturing, HVAF coatings extend component life, reduce downtime, and offer exceptional corrosion and wear resistance. Key materials include tungsten carbide, chromium carbide, and various metal alloys, each selected based on the application’s environmental demands. The growing focus on improving operational efficiency and reducing maintenance costs in high-value equipment is driving the adoption of HVAF coating systems. With regulatory pressure increasing on sustainability and lifecycle performance, HVAF coatings are positioned as an environmentally responsible alternative to hard chrome and other toxic legacy coatings. In 2024, the HVAF coating materials market saw increased traction across aerospace and power generation sectors. OEMs and MRO providers expanded the use of HVAF coatings for turbine blades, landing gear components, and pump housings due to their excellent adhesion, thermal resistance, and wear properties. Companies introduced new hybrid HVAF-HVOF systems to offer greater flexibility in coating operations. Additionally, material suppliers focused on developing finer carbide powders and custom alloy blends to meet application-specific demands. Environmental compliance also took center stage as more end-users moved away from hard chrome due to REACH regulations in Europe and similar policies in North America. Contract coating service providers upgraded their HVAF spray booths with automation and real-time quality monitoring to improve throughput and consistency. Several collaborative R&D projects between coating equipment manufacturers and academic institutions also resulted in prototype materials with improved microstructure and bond strength. Looking ahead to 2025 and beyond, the HVAF coating materials market is expected to evolve further with advancements in process control, material customization, and digital integration. AI and machine learning will play a greater role in optimizing spray parameters, predicting coating performance, and enabling closed-loop process adjustments. The expansion of hydrogen and renewable energy sectors will boost demand for high-durability coatings to protect components operating under extreme thermal and corrosive conditions. Additive manufacturing and component repair will open new frontiers for HVAF-compatible coatings that can be applied to complex geometries with minimal heat impact. Emerging economies in Asia and Latin America are likely to invest in HVAF coating capabilities as they scale up industrial production and seek to reduce imports of wear-prone components. Furthermore, sustainability goals will push manufacturers to develop coatings that are recyclable or have lower embedded carbon, reinforcing HVAF's role in next-generation surface engineering strategies. Trade Intelligence Ofhvaf coating materials market Global Other carbides (excl. Ca, Si, inorganic salts), Imports, USD million, 2020-24 2020 2021 2022 2023 2024 World 565 915 1036 841 831 United States of America 102 159 203 156 149 Germany 97 140 139 122 123 Japan 70 132 146 116 105 Sweden 56 106 116 86 93 Korea, Republic of 42 78 79 71 77 Source: OGAnalysis, (ITC) - United States of America, Germany, Japan, Sweden and Korea, Republic of are the top five countries importing 65.9% of global Other carbides (excl. Ca, Si, inorganic salts) in 2024 - Global Other carbides (excl. Ca, Si, inorganic salts) Imports increased by 46.9% between 2020 and 2024 - United States of America accounts for 18% of global Other carbides (excl. Ca, Si, inorganic salts) trade in 2024 - Germany accounts for 14.8% of global Other carbides (excl. Ca, Si, inorganic salts) trade in 2024 - Japan accounts for 12.6% of global Other carbides (excl. Ca, Si, inorganic salts) trade in 2024 Global Other carbides (excl. Ca, Si, inorganic salts) Export Prices, USD/Ton, 2020-24 Source: OGAnalysis Key Market Trends, Drivers and Challenges Hybrid thermal spray technologies combining HVAF and HVOF capabilities are becoming popular for enabling coating versatility, especially in aerospace and heavy machinery sectors where different surface properties are required across a single component. Increased adoption of eco-friendly HVAF coatings to replace hard chrome and cadmium plating due to environmental and worker safety regulations, particularly in Europe and North America, is driving material innovation and demand. Customization of feedstock materials is on the rise, with powder manufacturers offering fine-grained carbides and tailored alloy compositions optimized for specific performance targets such as high temperature oxidation resistance and extreme abrasion. Growing need for wear and corrosion-resistant coatings in high-performance sectors like oil & gas, marine, and energy, where downtime costs are significant and reliability is paramount, is pushing demand for advanced HVAF materials. Stringent global regulations (e.g., REACH, OSHA) banning or restricting toxic surface treatments are forcing manufacturers to adopt safer alternatives, making HVAF coatings a compliance-friendly replacement with comparable or superior performance. Technological advancements in spray systems and coating robots that support precise, repeatable HVAF application are reducing operational complexity and enabling wider adoption across industrial manufacturing and repair shops. High initial capital investment for HVAF systems and the need for skilled operators can limit adoption, especially among small-to-mid-sized enterprises in emerging markets or low-margin manufacturing sectors. Limited standardization in HVAF feedstock powders and process parameters across different suppliers can create inconsistency in coating quality and hinder scalability in global supply chains. Report Scope Parameter hvaf coating materials Market scope Detail Base Year 2024 Estimated Year 2025 Forecast Period 2026-2032 Market Size-Units USD billion Market Splits Covered By Product, By Application, By End User and By Technology Countries Covered North America (USA, Canada, Mexico) Europe (Germany, UK, France, Spain, Italy, Rest of Europe) Asia-Pacific (China, India, Japan, Australia, Rest of APAC) The Middle East and Africa (Middle East, Africa) South and Central America (Brazil, Argentina, Rest of SCA) Analysis Covered Latest Trends, Driving Factors, Challenges, Trade Analysis, Price Analysis, Supply-Chain Analysis, Competitive Landscape, Company Strategies Customization 10% free customization (up to 10 analyst hours) to modify segments, geographies, and companies analyzed Post-Sale Support 4 analyst hours, available up to 4 weeks Delivery Format The Latest Updated PDF and Excel Data file

Published:Jun-2025