"The Smart Container Market was valued at $ 7 billion in 2026 and is projected to reach $ 35.24 billion by 2034, growing at a CAGR of 22.34%."
The Smart Container Market is gaining strong momentum as logistics companies, shipping lines, cargo owners, and supply-chain operators seek better visibility, security, and control over goods in transit. Smart containers are equipped with sensors, GPS, IoT devices, connectivity modules, and data platforms that enable real-time monitoring of location, temperature, humidity, shock, door status, light exposure, and cargo condition. These solutions are widely used in maritime shipping, cold-chain logistics, pharmaceuticals, food and beverages, chemicals, electronics, retail, and high-value cargo transportation. Demand is being driven by the need to reduce cargo loss, prevent theft, improve delivery reliability, and strengthen end-to-end shipment transparency.
Market development is also supported by rising global trade complexity, growing cold-chain requirements, digital supply-chain transformation, and increasing customer expectations for accurate shipment updates. Smart containers help companies detect delays, monitor sensitive goods, optimize routing, reduce insurance risks, and improve compliance with quality and safety standards. Integration with cloud platforms, blockchain, AI analytics, and transportation management systems is improving the value of container data across logistics networks. However, adoption can be challenged by device cost, battery life, connectivity gaps, data integration issues, cybersecurity risks, and lack of standardization. Overall, smart containers are becoming important tools for building more transparent, resilient, and technology-enabled supply chains.
Regional Analysis
North America Smart Container Market
North America is a strong market for smart containers, supported by advanced logistics networks, cold-chain infrastructure, pharmaceutical distribution, food and beverage transportation, and high-value cargo movement. The United States leads regional adoption as shippers, retailers, healthcare distributors, and logistics companies increasingly demand real-time cargo visibility, temperature monitoring, route tracking, and security alerts. Demand is especially strong in refrigerated containers, intermodal freight, port-linked logistics, and inland distribution networks. Smart containers are also gaining relevance as companies focus on reducing cargo loss, improving delivery reliability, strengthening compliance, and integrating shipment data with transport management and warehouse systems.
Europe Smart Container Market
Europe is a significant smart container market, driven by strong maritime trade, advanced port infrastructure, pharmaceutical logistics, food exports, and sustainability-focused supply chains. Germany, the Netherlands, France, the UK, Spain, Belgium, and Nordic countries are important demand centers due to their logistics hubs, container ports, and high-value cargo flows. European adoption is supported by the need for better container visibility, emissions-efficient routing, cold-chain integrity, and digital documentation. Industry standards are also supporting growth, as DCSA’s IoT event standards aim to improve standardized data sharing for tracking and tracing containers fitted with IoT devices.
Asia-Pacific Smart Container Market
Asia-Pacific is one of the most attractive regions for smart containers due to its large manufacturing base, export-oriented trade, busy container ports, electronics supply chains, seafood exports, fresh food logistics, and pharmaceutical cold-chain expansion. China, Japan, South Korea, India, Singapore, Australia, Thailand, Vietnam, and Indonesia are key markets where smart containers support shipment visibility, cargo protection, and efficient port-to-destination movement. Adoption is rising across reefer cargo, electronics, chemicals, e-commerce logistics, and multimodal freight. Major shipping-line investments in IoT-enabled reefer and fleet connectivity are strengthening the region’s readiness for data-driven container logistics.
Middle East & Africa Smart Container Market
The Middle East & Africa market is developing steadily, supported by port modernization, food import dependence, pharmaceutical distribution, oil and gas logistics, and growing trade corridors. Gulf countries are key adopters due to strong investment in logistics hubs, free zones, cold-chain facilities, and smart port infrastructure. Smart containers are useful for monitoring temperature-sensitive foods, medicines, chemicals, and high-value shipments moving through long-distance maritime and inland routes. In Africa, adoption is more gradual and concentrated around major ports, mining exports, agricultural exports, and healthcare logistics, while challenges include connectivity gaps, cost sensitivity, and limited digital integration across fragmented supply chains.
South & Central America Smart Container Market
South & Central America offers growing opportunities for smart containers, led by food exports, agribusiness logistics, seafood shipments, pharmaceuticals, chemicals, and port-linked trade. Brazil, Mexico, Chile, Colombia, Argentina, Peru, and Ecuador are key markets where smart containers can improve visibility for fresh produce, meat, seafood, flowers, and temperature-sensitive cargo. Adoption is supported by the need to reduce spoilage, strengthen export quality control, improve customs visibility, and protect high-value shipments. Growth remains gradual due to cost sensitivity, uneven connectivity, and fragmented logistics infrastructure, but smart reefer containers and IoT tracking solutions are expected to gain wider use as exporters focus on reliability and compliance.
Trade Intelligence smart container market
| Global Transport containers for goods/fluids, designed for multimodal carriage , Imports, USD million, 2020-24 | |||||
|
| 2020 | 2021 | 2022 | 2023 | 2024 |
| World | 3,586 | 5,208 | 7,168 | 5,980 | 5,691 |
| United States of America | 500 | 1,029 | 1,759 | 1,112 | 824 |
| Germany | 309 | 412 | 485 | 409 | 359 |
| France | 173 | 246 | 273 | 292 | 260 |
| South Korea | 214 | 303 | 268 | 217 | 251 |
| Saudi Arabia | 108 | 154 | 243 | 193 | 235 |
| Source: OGAnalysis, International Trade Centre (ITC) | |||||
- United States of America , Germany , France , South Korea and Saudi Arabia are the top five countries importing 33.9% of global Transport containers for goods/fluids, designed for multimodal carriage in 2024
- Global Transport containers for goods/fluids, designed for multimodal carriage Imports increased by 58.7% between 2020 and 2024
- United States of America accounts for 14.5% of global Transport containers for goods/fluids, designed for multimodal carriage trade in 2024
- Germany accounts for 6.3% of global Transport containers for goods/fluids, designed for multimodal carriage trade in 2024
- France accounts for 4.6% of global Transport containers for goods/fluids, designed for multimodal carriage trade in 2024
| Global Transport containers for goods/fluids, designed for multimodal carriage Export Prices, USD/Ton, 2020-24 |
| |
| Source: OGAnalysis, International Trade Centre (ITC) |

Key Insights
- Smart container demand is supported by the growing need for real-time shipment visibility. Cargo owners and logistics providers use these systems to track location, movement, and cargo condition throughout the journey.
- Cold-chain logistics is one of the strongest application areas for smart containers. Temperature and humidity monitoring help protect pharmaceuticals, vaccines, seafood, dairy, fresh produce, and other sensitive goods.
- IoT sensors are central to smart container functionality. They collect data on temperature, shock, vibration, door opening, light exposure, and container environment to improve cargo safety.
- GPS and cellular connectivity improve container tracking across multimodal transport routes. These technologies help logistics teams identify delays, route deviations, theft risks, and delivery exceptions.
- Pharmaceutical and healthcare shipments are creating strong demand for smart containers. Strict product quality requirements make real-time monitoring important for maintaining integrity during transportation.
- Food and beverage companies are adopting smart containers to reduce spoilage and improve freshness. Monitoring systems help identify temperature abuse, handling issues, and cold-chain breaks.
- AI analytics is improving the value of smart container data. Predictive insights can support route optimization, risk detection, estimated arrival accuracy, and preventive intervention.
- Security applications are becoming increasingly important for high-value cargo. Door sensors, tamper alerts, geofencing, and movement tracking help reduce theft and unauthorized access.
- Integration with logistics platforms is a key market trend. Smart container data is increasingly connected with warehouse systems, transport management software, customs processes, and customer dashboards.
- Future growth will depend on affordability, connectivity reliability, and data standardization. Suppliers offering durable, interoperable, secure, and easy-to-deploy smart container solutions are likely to gain stronger market acceptance.
Global seaborne perishable reefer trade, 2018–2024 (million tonnes)
Figure: World seaborne perishable reefer trade has risen steadily from 2018 to 2024, reflecting the expansion of temperature-sensitive food and pharmaceutical shipments handled in reefer containers. As a growing share of this cargo requires end-to-end monitoring, shippers and logistics providers are investing in smart, IoT-enabled containers to track temperature, location, door status and security events in real time. OG Analysis estimates, derived from UN trade statistics and global reefer industry data, underline how trends in reefer trade volumes directly shape technology adoption, asset utilization and service differentiation in the smart container market.
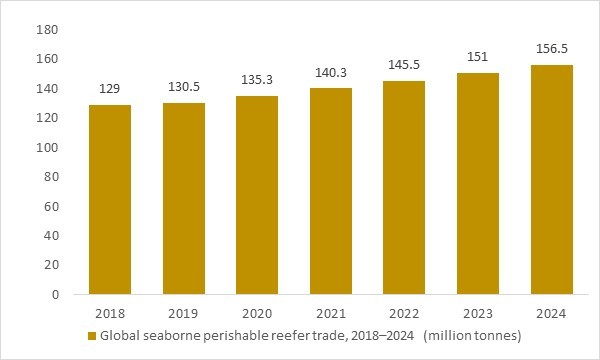
- Global seaborne perishable reefer trade has risen steadily from 2018 to 2024, reflecting the rapid expansion of temperature-sensitive food and pharma shipments. As more of this cargo moves in reefer containers, shippers and logistics providers are investing in smart, IoT-enabled containers to monitor temperature, location, and door status in real time. This OG Analysis chart highlights how growing reefer trade directly underpins long-term demand for advanced smart container solutions.
Report Scope
| Parameter | Smart Container Market Detail |
| Base Year | 2025 |
| Estimated Year | 2026 |
| Forecast Period | 2026-2034 |
| Market Size-Units | USD billion |
| Market Splits Covered | By Offering, By Technology, By Size, By Vertical |
| Countries Covered | North America (USA, Canada, Mexico) |
| Analysis Covered | Latest Trends, Driving Factors, Challenges, Trade Analysis, Price Analysis, Supply-Chain Analysis, Competitive Landscape, Company Strategies |
| Customization | 10% free customization (up to 10 analyst hours) to modify segments, geographies, and companies analyzed |
| Post-Sale Support | 4 analyst hours, available up to 4 weeks |
| Delivery Format | The Latest Updated PDF and Excel Data file |
Smart Container Market Segments Covered In The Report
By Offering
- Hardware
- Software
- Services
By Technology
- GPS (Global Positioning System)
- Cellular
- LoRa WAN (Long Range Wide Area Network)
- Bluetooth Low Energy (BLE)
- Other Technologies
By Size
- Small Enterprises
- Medium Enterprises
- Large Enterprises
By Vertical
- Food and Beverages
- Pharmaceuticals
- Oil and Gas
- Chemicals
- Other Verticals
By Geography
- North America (USA, Canada, Mexico)
- Europe (Germany, UK, France, Spain, Italy, Rest of Europe)
- Asia-Pacific (China, India, Japan, Australia, Vietnam, Rest of APAC)
- The Middle East and Africa (Middle East, Africa)
- South and Central America (Brazil, Argentina, Rest of SCA)
Key Market Players
American Telephone and Telegraph, MSC Mediterranean Shipping Company S.A., CMA CGM Société Anonyme, Hapag-Lloyd AG, Smart Containers Group Ltd., Carrier Transicold, Emerson Electric Co, Thermo King Corporation, Sealand - A Maersk Company A/S, Maersk Container Industry AS, Savi Technology Inc., ORBCOMM Inc., Sensitech Inc., Phillips Connect Technologies LLC, Nexiot AG, Zillionsource Technologies Company Limited, Ocean Insights GmbH, Clearpath Robotics, Traxens S.A., Identec Solutions AG, Globe Tracker ApS, Monnit Corporation, CargoSense Inc., SecureSystem GmbH, Ambrosus AG, Roambee Corporation, Starcom Systems, AELER Société par Actions Simplifiée, Loginno Logistic Innovation Ltd., Conweigh Pty Ltd
Recent Industry Developments
June 2025 – ORBCOMM launched CrewView, an onboard visibility solution empowering crews to monitor and manage smart refrigerated and dry containers in real time, enabling early detection of temperature deviations and power failures.
May 2025 – Maersk began rolling out its new digital connectivity platform across 450 vessels, upgrading from 2G to 4G infrastructure to enable faster, granular IoT tracking and smarter reefer container monitoring.
March 2025 – Folk Maritime became the first container operator in the Middle East to deploy ORBCOMM’s smart container technology across its dry container fleet, enhancing visibility, cargo security, and sustainability in regional shipping.
November 2024 – ORBCOMM introduced its latest generation dry container IoT solution, enhancing security with alerts for unauthorised access, fire risk, container damage, and improved cargo integrity monitoring.
January 2025 – GE and SAIC initiated development of a smart shipping container system tailored for expedited customs clearance, structured around U.S. Customs' requirements and designed as a flexible platform for future IoT advancements.
FAQ's
The Global Smart Container Market is estimated to generate USD 7 billion in revenue in 2026.
The Global Smart Container Market is expected to grow at a Compound Annual Growth Rate (CAGR) of 22.34% during the forecast period from 2026 to 2034.
The Smart Container Market is estimated to reach USD 35.24 billion by 2034.
Didn’t find what you’re looking for? TALK TO OUR ANALYST TEAM
Need something within your budget? NO WORRIES! WE GOT YOU COVERED!

