Triethyl Citrate Market Outlook Report

Published On: Feb, 2025
|
Pages: 145+

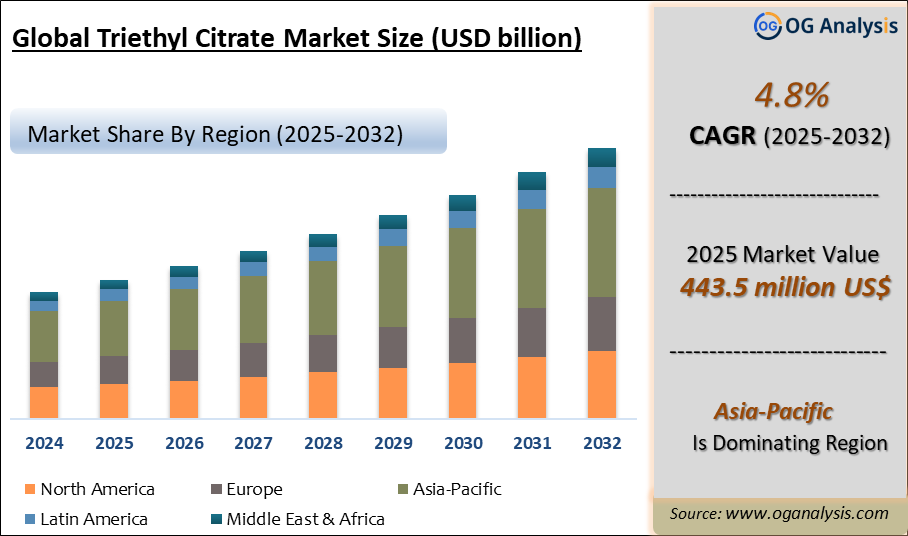
The Triethyl Citrate Market is estimated at USD 406.7 million in 2023. Further, the market is expected to grow from USD 423.2 million in 2024 to USD 589.9 million in 2031 at a CAGR of 4.8%.

Triethyl Citrate Market Overview

Triethyl Citrate also known as Ethyl Citrate, a chemical compound represented by the formula C12H20O7, plays an important role as a flavour enhancer, plasticizer, solubilizer, and emollient in different applications. Triethyl Citrate is a colourless oily liquid with a fruity odor. It is a highly pure and versatile ingredient, well known for its exceptional properties. It is prepared by the esterification of citric acid and ethanol in the presence of a catalyst. It's a versatile lightweight emollient that is non-blocking, non-greasy, has low viscosity, quickly absorbs, and leaves minimal stickiness on the skin. 
The applications of triethyl citrate are found in different industries including the food industry, pharmaceutical industry, cosmetics industry, personal care industry, and plastic and polymer industry. Triethyl citrate meets the highest standards of quality and is compliant with FG (USP-NF) and Food Chemicals Codex regulations, ensuring its suitability in different applications. Triethyl Citrate is used as a flavouring agent in foods, as a plasticizer in the pharmaceutical industry for coating, as a food additive for stabilizing foams, and as a pseudo-emulsifier in e-cigarette juices.

Global Triethyl Citrate Market Analysis 2025-2032: Industry Size, Share, Growth Trends, Competition and Forecast Report


Trade Intelligence for Triethyl Citrate Market

Global  Salts and esters of citric acid (excl. inorganic or organic compounds of mercury) Trade, Imports, USD million, 2020-24


2020

2021

2022

2023

2024

World

              660

              840

           1,356

           1,090

              952

United States of America

             74.4

              107

              186

              165

              141

France

             27.1

             33.9

             48.3

             50.6

             56.3

Germany

             42.4

             62.0

              101

             56.7

             50.5

Poland

             31.4

             56.0

             66.4

             80.3

             49.8

Netherlands

             50.1

             56.2

             99.3

             88.2

             48.9

Source: OGAnalysis, International Trade Centre (ITC)

- United States of America, France, Germany, Poland and Netherlands are the top five countries importing 36.4% of global  Salts and esters of citric acid (excl. inorganic or organic compounds of mercury) in 2024
- Global  Salts and esters of citric acid (excl. inorganic or organic compounds of mercury) Imports increased by 44.2% between 2020 and 2024
- United States of America accounts for 14.8% of global  Salts and esters of citric acid (excl. inorganic or organic compounds of mercury) trade in 2024
- France accounts for 5.9% of global  Salts and esters of citric acid (excl. inorganic or organic compounds of mercury) trade in 2024
- Germany accounts for 5.3% of global  Salts and esters of citric acid (excl. inorganic or organic compounds of mercury) trade in 2024

Global  Salts and esters of citric acid (excl. inorganic or organic compounds of mercury) Export Prices, USD/Ton, 2020-24

Source: OGAnalysis


Latest Trends in Triethyl Citrate Market

Emerging Applications of Triethyl Citrate in the Cosmetics & Personal Care Industry:  
Triethyl Citrate is used in the formulation for making skincare products such as hand creams, foot balsams, facial creams, sun care creams, hand creams, exfoliation creams, facial moisturizers, anti-aging creams and body lotions. Due to increasing middle-class disposable income and rising aspirations for a fulfilling life and attractive appearance, there is a greater demand for cosmetic products. Triethyl citrate is a common ingredient in numerous cosmetic and beauty products. Triethyl citrate is used by perfumers as a fixative, diluent, and solvent. 
Triethyl citrate is an effective solvent for lacquers, varnish, and deodorants because it mixes easily with water and a variety of organic substances. In personal care, Triethyl Citrate is used in infant care products, bath products, creams and lotions, cosmetic sprays and many other types of personal care products. It is also an active ingredient in many chemical skin peels. Triethyl citrate effectively mitigates the accumulation of undesirable body odor by impeding the activity of sweat-producing bacteria enzymes. Its skin tolerance, along with deodorizing attributes, make triethyl citrate highly suitable for deodorant formulations.

Driving Factors

Superior Properties of Triethyl Citrate:
The triethyl citrate market is estimated to experience growth during the forecast period, driven by its excellent properties. Triethyl citrate is generally considered a safe and non-toxic compound, as it improves the flexibility and softness of materials. Triethyl citrate is compatible with a variety of polymers which enhances its utility in different industrial applications. Triethyl citrate is biodegradable and has a low boiling point ensuring easy vaporization. It is a colourless, odourless liquid exhibiting notable solvency and minimal toxicity. 
Triethyl citrate possesses excellent flavour and fragrance enhancement properties, natural origin, and exceptional purity. Triethyl citrate is commonly included for its ability to control oil, promoting the well-being of skin and hair. Moreover, it enhances the viscosity of specific formulations, yielding a luxurious texture that is more user-friendly. Also, triethyl citrate serves as an effective solvent and perfuming agent, effectively masking the odors of other ingredients within a formulation. Triethyl citrate is a vital choice for companies focusing on green, natural, and organic mixture

Market Challenges

Strict Environmental Regulations Regarding Triethyl Citrate: 
Triethyl citrate is regulated differently across the globe, like in the U.S., it is regulated as a dietary supplement by the Food and Drug Administration (FDA). In the European Union, triethyl citrate is regulated as a food additive by the European Food Safety Authority (EFSA). In Canada, it is regulated as a food additive by Health Canada. In Australia, it is regulated as a food additive by Food Standards Australia New Zealand (FSANZ). 
In India, it is regulated as a food additive by the Food Safety and Standards Authority of India (FSSAI). An accidental release of triethyl citrate to the environment may pose a danger to fish, invertebrates and other aquatic organisms before degradation. Triethyl citrate is not expected to adsorb to suspended solids and sediment or accumulate in the tissues of aquatic organisms. The compound gets absorbed in the body by ingestion and inhalation causing irritation in the eyes, lung irritation with coughing and nausea, central nervous depression, and slowing of reflexes. This becomes the biggest limitation to the market growth. 

Companies Mentioned

  • BASF SE
  • Fuso Chemical Co., Ltd.
  • Merck KGaA
  • Jiangsu Lemon Chemical & Technology Co., Ltd
  • Debye Scientific Co., Ltd
  • A&J Pharmtech Co., LTD
  • RennoTech Co., Ltd
  • Finetech Industry Limited
  • Sigma-Aldrich
  • Tokyo Chemical Industry Co., Ltd.
  • MORIMURA BROS. Inc.
  • Viachem Ltd.
  • Vertellus

Report Scope

Parameter

Triethyl Citrate Market scope Detail

Base Year

2024

Estimated Year

2025

Forecast Period

2026-2032

Market Size-Units

USD million

Market Splits Covered

By Grade, By End-User, By Sales Channel

Countries Covered

North America (USA, Canada, Mexico)
Europe (Germany, UK, France, Spain, Italy, Rest of Europe)
Asia-Pacific (China, India, Japan, Australia, Rest of APAC)
The Middle East and Africa (Middle East, Africa)
South and Central America (Brazil, Argentina, Rest of SCA)

Analysis Covered

Latest Trends, Driving Factors, Challenges, Trade Analysis, Price Analysis, Supply-Chain Analysis, Competitive Landscape, Company Strategies

Customization

10% free customization (up to 10 analyst hours) to modify segments, geographies, and companies analyzed

Post-Sale Support

4 analyst hours, available up to 4 weeks

Delivery Format

The Latest Updated PDF and Excel Data file

Market Segmentation

By Grade

  • Industrial Grade
  • Food Grade
  • Pharmaceutical Grade

By End-Use Industry

  • Specialty Chemicals
  • Food & Beverages
  • Pharmaceutical
  • Cosmetics & Personal care
  • Other

By Sales Channel

  • Direct B2B
  • Offline Retail
  • Online

By Geography

  • North America (USA, Canada, Mexico)
  • Europe (Germany, UK, France, Spain, Italy, Russia, Rest of Europe)
  • Asia-Pacific (China, India, Japan, Australia, South Korea, Indonesia, Malaysia, Vietnam, Rest of APAC)
  • The Middle East and Africa (Saudi Arabia, South Africa, UAE, Iran, Egypt, Rest of MEA)
  • South and Central America (Brazil, Argentina, Chile, Rest of SCA)
     

Recent Developments 

  • September 2025: Jungbunzlauer announced the acquisition of a multipurpose production site in Thomson, Illinois, from International Flavors & Fragrances Inc., marking its first U.S. manufacturing footprint to expand local production of citric acid derivatives including triethyl citrate.
  • August 2025: Jungbunzlauer received the EcoVadis Platinum Medal for sustainability excellence, ranking among the top 1% of companies globally for ethical, social, and environmental performance in chemical manufacturing.
  • July 2025: BASF revised its 2025 financial outlook downward due to weaker global demand for specialty and base chemicals, affecting product categories such as plasticizers and citrates used in coatings and personal care formulations.
  • July 2025: Jungbunzlauer introduced TayaGel LA, a new low-acyl gellan gum designed for clean-label formulations, strengthening its biobased ingredient portfolio alongside its citrate product range.
  • April 2025: BASF reported lower quarterly sales and margins driven by ongoing chemical market headwinds, signaling continued cost and demand pressures across its performance materials and plasticizer value chains.

TABLE OF CONTENTS

1. GLOBAL TRIETHYL CITRATEINDUSTRY
1.1. Market Scope and Definition
1.2. Study Assumptions

2. TRIETHYL CITRATE MARKET LATEST TRENDS, DRIVERS AND CHALLENGES, 2023-2031
2.1. Triethyl Citrate Market Latest Trends
2.1.1. Emerging Applications of Triethyl Citrate in the Cosmetics & Personal Care Industry:
2.1.2. Emphasis on Sustainable and Biodegradable Compounds:
2.1.3. Demand for Natural and Clean-Label Products:
2.1.4. Innovation in Plasticizer Technology:
2.2. Triethyl Citrate Market Insights, 2023-2031
2.2.1. Leading Triethyl Citrate by Grade, 2023-2031
2.2.2. Dominant Triethyl Citrate by End-Use Industry, 2023-2031
2.2.3. Leading Triethyl Citrate Sales Channel, 2023-2031
2.2.4. Fast-Growing Geographies for Triethyl Citrate, 2023-2031
2.3. Triethyl Citrate Demand Drivers to 2031
2.3.1. Superior Properties of Triethyl Citrate:
2.3.2. Growing Usage of Triethyl Citrate in Different End-User Industries:
2.3.3. Growing Demand for Polymer Modifiers and Lubricants:
2.3.4. Rising Automotive and Construction Industry in Emerging Regions:
2.4. Triethyl Citrate Challenges to 2031
2.4.1. Strict Environmental Regulations Regarding Triethyl Citrate:
2.4.2. Fluctuations in Raw Material Prices & Competition with Other Plasticizers:
2.5. Triethyl Citrate Market-Five Forces Analysis

3. GLOBAL TRIETHYL CITRATE MARKET VALUE, MARKET SHARE, AND FORECAST TO 2031
3.1. Global Triethyl Citrate Market Overview, 2023
3.2. Global Triethyl Citrate Market Size and Share Outlook, By Grade, 2023-2031
3.2.1. Industrial Grade
3.2.2. Food Grade
3.2.3. Pharmaceutical Grade
3.3. Global Triethyl Citrate Market Size and Share Outlook, By End-Use Industry, 2023-2031
3.3.1. Specialty Chemicals
3.3.2. Food & Beverages
3.3.3. Pharmaceutical
3.3.4. Cosmetics & Personal care
3.3.5. Others
3.4. Global Triethyl Citrate Market Size and Share Outlook, By Sales Channel, 2023-2031
3.4.1. Direct B2B
3.4.2. Offline Retail
3.4.3. Online
3.5. Global Triethyl Citrate Market Size and Share Outlook by Region, 2023-2031

4. NORTH AMERICA TRIETHYL CITRATE MARKET VALUE, MARKET SHARE, AND FORECAST TO 2031
4.1. North America Triethyl Citrate Market Overview, 2023
4.2. North America Triethyl Citrate Market Size and Share Outlook By Grade, 2023-2031
4.3. North America Triethyl Citrate Market Size and Share Outlook, By End-Use Industry, 2023-2031
4.4. North America Triethyl Citrate Market Size and Share Outlook By Sales Channel, 2023-2031
4.5. North America Triethyl Citrate Market Size and Share Outlook by Country, 2023-2031
4.5.1. United States
4.5.2. Canada
4.5.3. Mexico

5. EUROPE TRIETHYL CITRATE MARKET VALUE, MARKET SHARE, AND FORECAST TO 2031
5.1. Europe Triethyl Citrate Market Overview, 2023
5.2. Europe Triethyl Citrate Market Size and Share Outlook By Grade, 2023-2031
5.3. Europe Triethyl Citrate Market Size and Share Outlook, By End-Use Industry, 2023-2031
5.4. Europe Triethyl Citrate Market Size and Share Outlook By Sales Channel, 2023-2031
5.5. Europe Triethyl Citrate Market Size and Share Outlook by Country, 2023-2031
5.5.1. Germany
5.5.2. France
5.5.3. United Kingdom
5.5.4. Italy
5.5.5. Spain
5.5.6. Rest of Europe

6. ASIA PACIFIC TRIETHYL CITRATE MARKET VALUE, MARKET SHARE AND FORECAST TO 2031
6.1. Asia Pacific Triethyl Citrate Market Overview, 2023
6.2. Asia Pacific Triethyl Citrate Market Size and Share Outlook By Grade, 2023-2031
6.3. Asia Pacific Triethyl Citrate Market Size and Share Outlook, By End-Use Industry, 2023-2031
6.4. Asia Pacific Triethyl Citrate Market Size and Share Outlook By Sales Channel, 2023-2031
6.5. Asia Pacific Triethyl Citrate Market Size and Share Outlook by Country, 2023-2031
6.5.1. China
6.5.2. Japan
6.5.3. India
6.5.4. Rest of Asia Pacific

7. SOUTH AND CENTRAL AMERICA TRIETHYL CITRATE MARKET VALUE, MARKET SHARE AND FORECAST TO 2031
7.1. South and Central America Triethyl Citrate Market Overview, 2023
7.2. South and Central America Triethyl Citrate Market Size and Share Outlook By Grade, 2023-2031
7.3. South and Central America Triethyl Citrate Market Size and Share Outlook, By End-Use Industry, 2023-2031
7.4. South and Central America Triethyl Citrate Market Size and Share Outlook By Sales Channel, 2023-2031
7.5. South and Central America Triethyl Citrate Market Size and Share Outlook by Country, 2023-2031
7.5.1. Brazil
7.5.2. Argentina
7.5.3. Rest of South and Central America

8. MIDDLE EAST AFRICA TRIETHYL CITRATE MARKET VALUE, MARKET SHARE AND FORECAST TO 2031
8.1. Middle East Africa Triethyl Citrate Market Overview, 2023
8.2. Middle East Africa Triethyl Citrate Market Size and Share Outlook By Grade, 2023-2031
8.3. Middle East Africa Triethyl Citrate Market Size and Share Outlook, By End-Use Industry, 2023-2031
8.4. Middle East Africa Triethyl Citrate Market Size and Share Outlook By Sales Channel, 2023-2031
8.5. Middle East Africa Triethyl Citrate Market Size and Share Outlook by Country, 2023-2031
8.5.1. Middle East
8.5.2. Africa

9. TRIETHYL CITRATE MARKET STRUCTURE
9.1. BASF SE
9.2. Fuso Chemical Co.,Ltd.
9.3. Merck KGaA
9.4. Jiangsu Lemon Chemical & Technology Co., Ltd
9.5. Finetech Industry Limited

10. TRIETHYL CITRATE RELATED TRADE DATA

11. APPENDIX
11.1. About Us
11.2. Sources
11.3. Research Methodology
11.4. Research Process
11.5. Research Execution
11.6. Contact Information


Get Free Sample

At OG Analysis, we understand the importance of informed decision-making in today's dynamic business landscape. To help you experience the depth and quality of our market research reports, we offer complimentary samples tailored to your specific needs.

Start Now! Please fill the form below for your free sample.

Why Request a Free Sample?

Evaluate Our Expertise: Our reports are crafted by industry experts and seasoned analysts. Requesting a sample allows you to assess the depth of research and the caliber of insights we provide.

Tailored to Your Needs: Let us know your industry, market segment, or specific topic of interest. Our free samples are customized to ensure relevance to your business objectives.

Witness Actionable Insights: See firsthand how our reports go beyond data, offering actionable insights and strategic recommendations that can drive your business forward.

Embark on your journey towards strategic decision-making by requesting a free sample from OG Analysis. Experience the caliber of insights that can transform the way you approach your business challenges.

You can purchase individual sections of this report. Explore pricing options for specific sections.
License

$4150- 30%

$6450- 40%

$8450- 50%

$2850- 20%

Didn’t find what you’re looking for? TALK TO OUR ANALYST TEAM

Need something within your budget? NO WORRIES! WE GOT YOU COVERED!

Related Products

Ground Calcium Carbonate Market Outlook Report

Ground Calcium Carbonate Market Overview Ground calcium carbonate commonly referred to as GCC is finely ground limestone or marble, a calcium carbonate material having the chemical formula, CaCO3. GCC accounts for more than 80% of the Calcium carbonate market that is available in Ground Calcium Carbonate (GCC) and Precipitated Calcium Carbonate (PCC) forms. GCC is produced by mechanical grinding of the raw material, limestone, and then classified to the desired size without involving any chemical change in the process. In a magnified view, the distribution of particle sizes in a GCC is much broader than for a PCC of the same size, implying that there are many more large particles and many more small particles than in a PCC. The size of the largest of the particles (the ""top size"") is much greater for a GCC than for a PCC, thus making GCC a less refined version of Calcium carbonate. GCC is widely used as an industrial mineral is differentiated by three primary attributes - particle size, color and chemical purity. The mineral finds application in various industries based on its quality and suitability of use. Trade Intelligence forGround Calcium Carbonate Market Global Calcium carbonate Trade, Imports, USD million, 2020-24 2020 2021 2022 2023 2024 World 917 1,067 1,141 964 922 Germany 95.7 103 89.6 73.6 67.3 India 79.9 141 164 68.9 63.7 Saudi Arabia 33.8 37.9 35.8 29.5 39.2 Indonesia 31.5 37.9 44.1 40.5 38.4 United States of America 28.0 29.7 47.3 35.9 35.7 Source: OGAnalysis, International Trade Centre (ITC) - Germany, India, Saudi Arabia, Indonesia and United States of America are the top five countries importing 26.5% of global Calcium carbonate in 2024 - Global Calcium carbonate Imports increased by 0.5% between 2020 and 2024 - Germany accounts for 7.3% of global Calcium carbonate trade in 2024 - India accounts for 6.9% of global Calcium carbonate trade in 2024 - Saudi Arabia accounts for 4.3% of global Calcium carbonate trade in 2024 Global Calcium carbonate Export Prices, USD/Ton, 2020-24 Source: OGAnalysis Latest Trends in Ground Calcium Carbonate Market Growing Usage of Calcium Carbonate as Industrial Filler: Industrial filler has been the top and continuously growing application for calcium carbonate. Finely ground calcium carbonate is used as a filler in plastics, paints, and paper to improve aesthetics, and functionality and to save on filling costs. Calcium carbonate consumption as the filler has the potential to exceed calcium carbonate used as a dimension stone, in a few key markets. The most abundant sources of carbonate mineral fillers are the reserves of white marble. The most important attributes of carbonate fillers that decide their usefulness in industrial applications are particle size, brightness (whiteness), and chemical purity. Fillers were earlier used to substitute costlier materials in paint or polymers in rubbers or plastics. Currently, they are being used to add stiffness, color, opacity, or other required qualities to a product. Innovative technologies allowing the usage of GCC in new applications without altering the originality and functionality are aiding further penetration of GCC. Driving Factors Increase in Demand from the Construction and Infrastructure Sector: Robust development in construction and infrastructure activities across the world is generating demand for paints, coatings, adhesives, ceramics and various other polymers and concretes. These end-users are further deriving demand for ground calcium carbonate materials. Increasing Population, growing urbanization and fast-developing economies, especially in Asia and the Middle East, have led to growth in the need for infrastructure. Huge developments in infra projects and high-rise apartments necessitate lightweight and cost-effective options. Ground Calcium Carbonate is evolving robustly to match those requirements precisely. Market Challenges Environmental hazards of limestone mining: Limestone mining can disturb groundwater conditions. Limestone deposits frequently arise in association with karst, a landscape where limestone gradually dissolves underground. The deposits result in caves, sinkholes, and areas of rock ruptures that create underground drainage areas. Mining in karst can disturb natural aquifers and alter the flow of the underground water. Excavating operations often remove ground water to expose the mining site; this can decrease the level of the water table and alter water flows through rock formations. Streams and rivers can be changed when mines pump excess water from a limestone quarry into natural downstream channels. This increases the danger of flooding and any pollutants or alterations in water quality disturb the surface water. Report Scope Parameter Ground Calcium Carbonate market scope Detail Base Year 2024 Estimated Year 2025 Forecast Period 2026-2032 Market Size-Units USD million Market Splits Covered By form, By End-User Countries Covered North America (USA, Canada, Mexico) Europe (Germany, UK, France, Spain, Italy, Rest of Europe) Asia-Pacific (China, India, Japan, Australia, Rest of APAC) The Middle East and Africa (Middle East, Africa) South and Central America (Brazil, Argentina, Rest of SCA) Analysis Covered Latest Trends, Driving Factors, Challenges, Trade Analysis, Price Analysis, Supply-Chain Analysis, Competitive Landscape, Company Strategies Customization 10% free customization (up to 10 analyst hours) to modify segments, geographies, and companies analyzed Post-Sale Support 4 analyst hours, available up to 4 weeks Delivery Format The Latest Updated PDF and Excel Data file

Published:Feb-2025

TPU Filament Market Analysis and Outlook Report: Industry Size, Share, Growth Trends, and Forecast (2025-2034)

The TPU Filament Market is rapidly evolving as additive manufacturing gains widespread traction across sectors such as automotive, healthcare, sportswear, electronics, and industrial design. Thermoplastic polyurethane (TPU) filament is particularly prized for its flexibility, durability, and resistance to abrasion, making it an ideal choice for printing parts that require elasticity and mechanical performance. From wearable components and protective gear to seals, gaskets, and functional prototypes, TPU is becoming a go-to material in FDM (Fused Deposition Modeling) 3D printing. As the demand for customizable, on-demand, and lightweight components grows, industries are increasingly turning to TPU filament for producing complex geometries with enhanced tactile properties and chemical resistance, while also benefiting from shorter production lead times. Advancements in extrusion technology and material formulation are significantly enhancing the printability and consistency of TPU filaments. Key players are investing in R&D to develop high-flow variants, antimicrobial properties, and filaments with optimized surface finish and shore hardness. Asia-Pacific is emerging as a production and consumption hub due to its expanding electronics and automotive base, while North America and Europe remain strongholds of innovation and early adoption. Market competitiveness is intensifying with a mix of specialized filament producers and global polymer giants offering tailored grades of TPU to meet application-specific needs. Custom color matching, low-odor processing, and bio-based TPU innovations are also shaping strategic differentiation among manufacturers. Trade Intelligence-TPU Filament Market Global monofilaments, rods, sticks & profiles (>1 mm, excl. ethylene/vinyl chloride) , Imports, USD million, 2020-24 2020 2021 2022 2023 2024 World 2,126 2,646 2,802 2,627 2,639 United States of America 205 245 270 241 234 Germany 177 221 245 224 204 United Kingdom 93 84 127 113 125 France 114 148 168 147 123 Poland 91 116 124 108 118 Source: OGAnalysis, International Trade Centre (ITC) - United States of America , Germany , United Kingdom , France and Poland are the top five countries importing 30.5% of global monofilaments, rods, sticks & profiles (>1 mm, excl. ethylene/vinyl chloride) in 2024 - Global monofilaments, rods, sticks & profiles (>1 mm, excl. ethylene/vinyl chloride) Imports increased by 24.1% between 2020 and 2024 - United States of America accounts for 8.9% of global monofilaments, rods, sticks & profiles (>1 mm, excl. ethylene/vinyl chloride) trade in 2024 - Germany accounts for 7.7% of global monofilaments, rods, sticks & profiles (>1 mm, excl. ethylene/vinyl chloride) trade in 2024 - United Kingdom accounts for 4.7% of global monofilaments, rods, sticks & profiles (>1 mm, excl. ethylene/vinyl chloride) trade in 2024 Global monofilaments, rods, sticks & profiles (>1 mm, excl. ethylene/vinyl chloride) Export Prices, USD/Ton, 2020-24 Source: OGAnalysis, International Trade Centre (ITC) Key Takeaways – TPU Filament Market TPU filaments are increasingly used in consumer electronics, sportswear, and medical device prototyping due to their flexibility and strength. Rising adoption of desktop 3D printing in SMEs and educational institutions is contributing to the growing demand for easy-to-use TPU filament. Improved printability with dual extrusion compatibility and lower warping issues is broadening the user base for TPU filaments. Manufacturers are developing TPU filaments with enhanced chemical resistance for industrial applications like sealing, gasketing, and cable sheathing. Increased focus on sustainability is driving R&D in recyclable and bio-based TPU filament options for eco-conscious users. Asia-Pacific leads in manufacturing growth due to its cost-efficient production base and expanding end-use sectors. North America remains a top region for innovation, particularly in advanced medical devices, prosthetics, and sports gear using TPU filament. Limited compatibility of some TPU grades with entry-level 3D printers remains a challenge for widespread adoption in hobbyist markets. Price sensitivity and availability of low-cost alternatives can impact premium TPU filament adoption in cost-focused markets. Strategic alliances between filament manufacturers and 3D printer companies are helping standardize material-printer compatibility. Online distribution channels and DTC (direct-to-consumer) models are reshaping the filament supply landscape, offering more customization options. Demand for TPU filament with antibacterial and flame-retardant properties is rising in healthcare and industrial applications. Color variety, matte finish options, and flexible shore hardness grades are becoming key differentiators in a competitive landscape. Growth in e-commerce and DIY printing is supporting demand for packaged TPU filaments designed for user convenience and easy storage. Supply chain disruptions and fluctuations in TPU resin prices occasionally affect lead times and pricing consistency for filament manufacturers. Report Scope Parameter TPU Filament Market scope Detail Base Year 2024 Estimated Year 2025 Forecast Period 2026-2032 Market Size-Units USD billion Market Splits Covered By Product Type, By Application, By End User, By Technology, and By Distribution Channel Countries Covered North America (USA, Canada, Mexico) Europe (Germany, UK, France, Spain, Italy, Rest of Europe) Asia-Pacific (China, India, Japan, Australia, Rest of APAC) The Middle East and Africa (Middle East, Africa) South and Central America (Brazil, Argentina, Rest of SCA) Analysis Covered Latest Trends, Driving Factors, Challenges, Trade Analysis, Price Analysis, Supply-Chain Analysis, Competitive Landscape, Company Strategies Customization 10% free customization (up to 10 analyst hours) to modify segments, geographies, and companies analyzed Post-Sale Support 4 analyst hours, available up to 4 weeks Delivery Format The Latest Updated PDF and Excel Data file

Published:May-2025

HVAF Coating Materials Market Analysis and Outlook Report: Industry Size, Share, Growth Trends, and Forecast (2025-2034)

High Velocity Air Fuel (HVAF) coating materials are emerging as a preferred solution in industries requiring durable surface treatments for critical components. These materials are applied using HVAF thermal spray technology, which combines high particle velocity with lower flame temperatures, resulting in dense, hard coatings with minimal oxidation. Commonly used in aerospace, oil & gas, energy, and manufacturing, HVAF coatings extend component life, reduce downtime, and offer exceptional corrosion and wear resistance. Key materials include tungsten carbide, chromium carbide, and various metal alloys, each selected based on the application’s environmental demands. The growing focus on improving operational efficiency and reducing maintenance costs in high-value equipment is driving the adoption of HVAF coating systems. With regulatory pressure increasing on sustainability and lifecycle performance, HVAF coatings are positioned as an environmentally responsible alternative to hard chrome and other toxic legacy coatings. In 2024, the HVAF coating materials market saw increased traction across aerospace and power generation sectors. OEMs and MRO providers expanded the use of HVAF coatings for turbine blades, landing gear components, and pump housings due to their excellent adhesion, thermal resistance, and wear properties. Companies introduced new hybrid HVAF-HVOF systems to offer greater flexibility in coating operations. Additionally, material suppliers focused on developing finer carbide powders and custom alloy blends to meet application-specific demands. Environmental compliance also took center stage as more end-users moved away from hard chrome due to REACH regulations in Europe and similar policies in North America. Contract coating service providers upgraded their HVAF spray booths with automation and real-time quality monitoring to improve throughput and consistency. Several collaborative R&D projects between coating equipment manufacturers and academic institutions also resulted in prototype materials with improved microstructure and bond strength. Looking ahead to 2025 and beyond, the HVAF coating materials market is expected to evolve further with advancements in process control, material customization, and digital integration. AI and machine learning will play a greater role in optimizing spray parameters, predicting coating performance, and enabling closed-loop process adjustments. The expansion of hydrogen and renewable energy sectors will boost demand for high-durability coatings to protect components operating under extreme thermal and corrosive conditions. Additive manufacturing and component repair will open new frontiers for HVAF-compatible coatings that can be applied to complex geometries with minimal heat impact. Emerging economies in Asia and Latin America are likely to invest in HVAF coating capabilities as they scale up industrial production and seek to reduce imports of wear-prone components. Furthermore, sustainability goals will push manufacturers to develop coatings that are recyclable or have lower embedded carbon, reinforcing HVAF's role in next-generation surface engineering strategies. Trade Intelligence Ofhvaf coating materials market Global Other carbides (excl. Ca, Si, inorganic salts), Imports, USD million, 2020-24 2020 2021 2022 2023 2024 World 565 915 1036 841 831 United States of America 102 159 203 156 149 Germany 97 140 139 122 123 Japan 70 132 146 116 105 Sweden 56 106 116 86 93 Korea, Republic of 42 78 79 71 77 Source: OGAnalysis, (ITC) - United States of America, Germany, Japan, Sweden and Korea, Republic of are the top five countries importing 65.9% of global Other carbides (excl. Ca, Si, inorganic salts) in 2024 - Global Other carbides (excl. Ca, Si, inorganic salts) Imports increased by 46.9% between 2020 and 2024 - United States of America accounts for 18% of global Other carbides (excl. Ca, Si, inorganic salts) trade in 2024 - Germany accounts for 14.8% of global Other carbides (excl. Ca, Si, inorganic salts) trade in 2024 - Japan accounts for 12.6% of global Other carbides (excl. Ca, Si, inorganic salts) trade in 2024 Global Other carbides (excl. Ca, Si, inorganic salts) Export Prices, USD/Ton, 2020-24 Source: OGAnalysis Key Market Trends, Drivers and Challenges Hybrid thermal spray technologies combining HVAF and HVOF capabilities are becoming popular for enabling coating versatility, especially in aerospace and heavy machinery sectors where different surface properties are required across a single component. Increased adoption of eco-friendly HVAF coatings to replace hard chrome and cadmium plating due to environmental and worker safety regulations, particularly in Europe and North America, is driving material innovation and demand. Customization of feedstock materials is on the rise, with powder manufacturers offering fine-grained carbides and tailored alloy compositions optimized for specific performance targets such as high temperature oxidation resistance and extreme abrasion. Growing need for wear and corrosion-resistant coatings in high-performance sectors like oil & gas, marine, and energy, where downtime costs are significant and reliability is paramount, is pushing demand for advanced HVAF materials. Stringent global regulations (e.g., REACH, OSHA) banning or restricting toxic surface treatments are forcing manufacturers to adopt safer alternatives, making HVAF coatings a compliance-friendly replacement with comparable or superior performance. Technological advancements in spray systems and coating robots that support precise, repeatable HVAF application are reducing operational complexity and enabling wider adoption across industrial manufacturing and repair shops. High initial capital investment for HVAF systems and the need for skilled operators can limit adoption, especially among small-to-mid-sized enterprises in emerging markets or low-margin manufacturing sectors. Limited standardization in HVAF feedstock powders and process parameters across different suppliers can create inconsistency in coating quality and hinder scalability in global supply chains. Report Scope Parameter hvaf coating materials Market scope Detail Base Year 2024 Estimated Year 2025 Forecast Period 2026-2032 Market Size-Units USD billion Market Splits Covered By Product, By Application, By End User and By Technology Countries Covered North America (USA, Canada, Mexico) Europe (Germany, UK, France, Spain, Italy, Rest of Europe) Asia-Pacific (China, India, Japan, Australia, Rest of APAC) The Middle East and Africa (Middle East, Africa) South and Central America (Brazil, Argentina, Rest of SCA) Analysis Covered Latest Trends, Driving Factors, Challenges, Trade Analysis, Price Analysis, Supply-Chain Analysis, Competitive Landscape, Company Strategies Customization 10% free customization (up to 10 analyst hours) to modify segments, geographies, and companies analyzed Post-Sale Support 4 analyst hours, available up to 4 weeks Delivery Format The Latest Updated PDF and Excel Data file

Published:Jun-2025