Aerial Equipment Market Analysis and Outlook Report: Industry Size, Share, Growth Trends, and Forecast (2025-2032)

Published On: Mar, 2025
|
Pages: 163

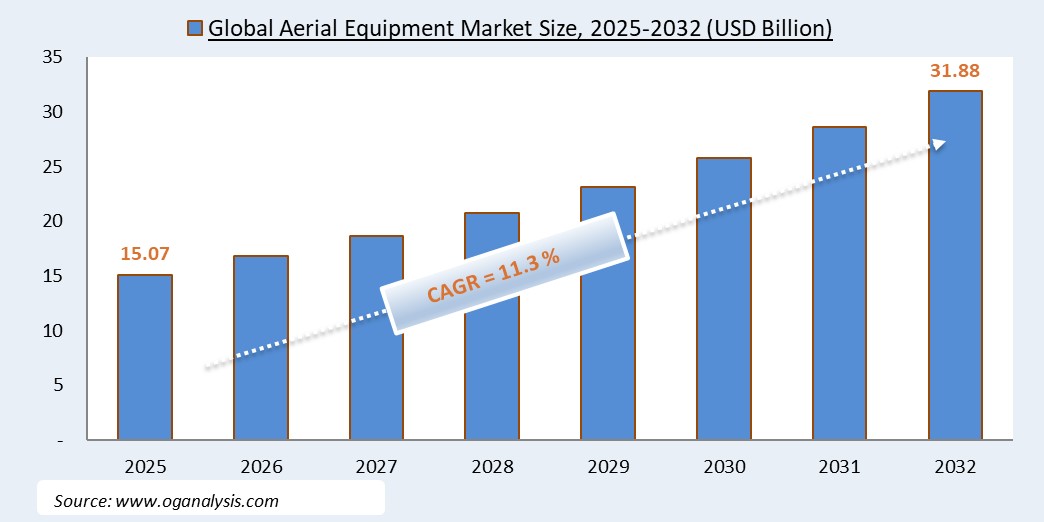
"The Global Aerial Equipment Market is valued at USD 15.07 Billion in 2025. Worldwide sales of Aerial Equipment Market are expected to grow at a significant CAGR of 11.3%, reaching USD 31.88 Billion by the end of the forecast period in 2032."

Aerial Equipment Market Overview

The aerial equipment market has become an essential part of the construction, maintenance, and logistics industries, offering solutions for working at heights with safety and efficiency. Aerial equipment includes boom lifts, scissor lifts, telehandlers, and vertical mast lifts, among others, and is widely used in infrastructure projects, warehousing, and energy sectors. The growing demand for urbanization, smart city development, and commercial real estate has fueled market growth, particularly in emerging economies. Technological advancements have led to the adoption of electric and hybrid-powered aerial lifts, reducing emissions and improving operational efficiency. Safety regulations and workplace compliance standards are also driving demand for advanced aerial equipment with better stability, weight capacity, and operator controls. With rental services becoming increasingly popular due to cost-effectiveness, the market is witnessing a shift towards equipment-sharing models. As industries continue to prioritize productivity and worker safety, aerial equipment manufacturers are innovating with automation, telematics, and remote monitoring solutions to enhance operational capabilities.

In 2024, the aerial equipment market has seen rapid developments driven by strong infrastructure investments and the adoption of sustainable technologies. The push for eco-friendly construction and industrial solutions has accelerated the demand for battery-operated aerial lifts, reducing dependence on diesel-powered models. Major players have focused on expanding their electric and hybrid product portfolios, catering to regulations aimed at reducing carbon footprints. Additionally, the integration of IoT and AI-powered fleet management systems has gained traction, allowing operators to track real-time performance metrics, predictive maintenance schedules, and energy consumption insights. The rental segment continues to dominate, as contractors and businesses prefer flexible leasing options over outright ownership, minimizing capital expenditure while ensuring access to the latest technology. Moreover, increased construction activities in Asia-Pacific, the Middle East, and North America have driven the sales of aerial lifts, with China and India emerging as key growth markets. Labor safety concerns and stringent compliance measures have further encouraged businesses to adopt advanced aerial work platforms with enhanced stability and automation features.

Global Aerial Equipment Market Size, 2025-2032 (USD Billion)

Looking ahead to 2025 and beyond, the aerial equipment market is expected to evolve with innovations in energy efficiency, automation, and connectivity. Hydrogen fuel cell technology and advanced lithium-ion battery solutions are anticipated to gain prominence, offering longer operational hours and faster charging times. Manufacturers will likely integrate machine learning algorithms into equipment for predictive maintenance, reducing downtime and improving fleet optimization. Additionally, autonomous and remotely operated aerial work platforms are set to transform operations, particularly in hazardous or hard-to-reach environments such as wind farms, oil rigs, and high-rise construction projects. The demand for sustainable and cost-effective aerial equipment will push rental and leasing companies to adopt digital platforms for seamless booking, fleet tracking, and maintenance management. Asia-Pacific and Europe are projected to lead the market growth, driven by rapid urbanization and infrastructure projects. Moreover, regulatory changes promoting zero-emission equipment and safety advancements will shape product development, ensuring the market remains dynamic and forward-focused.

Market Segmentation

  • By Product Type:
    • Boom Lifts
    • Scissor Lifts
    • Vertical Mast Lifts
    • Telehandlers
    • Spider Lifts
  • By Power Source:
    • Diesel-Powered
    • Electric-Powered
    • Hybrid-Powered
  • By Application:
    • Construction
    • Warehousing & Logistics
    • Energy & Utilities
    • Manufacturing
    • Government & Public Sector
  • By End User:
    • Rental Companies
    • Direct End-Users
  • By Geography:
    • North America (U.S., Canada, Mexico)
    • Europe (Germany, U.K., France, Italy, Spain, Rest of Europe)
    • Asia-Pacific (China, India, Japan, South Korea, ASEAN, Rest of Asia-Pacific)
    • Latin America (Brazil, Argentina, Rest of Latin America)
    • Middle East & Africa (GCC, South Africa, Rest of MEA)

Major Players in the Aerial Equipment Market

  • JLG Industries, Inc.
  • Terex Corporation
  • Haulotte Group
  • Skyjack (Linamar Corporation)
  • Genie (Terex Aerial Work Platforms)
  • Manitou Group
  • Aichi Corporation
  • Niftylift Ltd.
  • Snorkel International
  • JCB
  • Dingli Machinery
  • Zoomlion Heavy Industry Science and Technology Co., Ltd.
  • Hunan Sinoboom Intelligent Equipment Co., Ltd.
  • IMER Group
  • Bronto Skylift


1. Table of Contents
1.1 List of Tables
1.2 List of Figures

2. Aerial Equipment Market Latest Trends, Drivers and Challenges, 2024 - 2032
2.1 Aerial Equipment Market Overview
2.2 Market Strategies of Leading Aerial Equipment Companies
2.3 Aerial Equipment Market Insights, 2024 - 2032
2.3.1 Leading Aerial Equipment Types, 2024 - 2032
2.3.2 Leading Aerial Equipment End-User industries, 2024 - 2032
2.3.3 Fast-Growing countries for Aerial Equipment sales, 2024 - 2032
2.4 Aerial Equipment Market Drivers and Restraints
2.4.1 Aerial Equipment Demand Drivers to 2032
2.4.2 Aerial Equipment Challenges to 2032
2.5 Aerial Equipment Market- Five Forces Analysis
2.5.1 Aerial Equipment Industry Attractiveness Index, 2024
2.5.2 Threat of New Entrants
2.5.3 Bargaining Power of Suppliers
2.5.4 Bargaining Power of Buyers
2.5.5 Intensity of Competitive Rivalry
2.5.6 Threat of Substitutes

3. Global Aerial Equipment Market Value, Market Share, and Forecast to 2032
3.1 Global Aerial Equipment Market Overview, 2024
3.2 Global Aerial Equipment Market Revenue and Forecast, 2024 - 2032 (US$ Million)

3.3 Global Aerial Equipment Market Size and Share Outlook By Product Type, 2024 - 2032
3.3.1 Boom Lifts
3.3.2 Scissor Lifts
3.3.3 Vertical Mast Lifts
3.3.4 Telehandlers
3.3.5 Spider Lifts

3.4 Global Aerial Equipment Market Size and Share Outlook By Power Source, 2024 - 2032
3.4.1 Diesel-Powered
3.4.2 Electric-Powered
3.4.3 Hybrid-Powered

3.5 Global Aerial Equipment Market Size and Share Outlook By Application, 2024 - 2032
3.5.1 Construction
3.5.2 Warehousing & Logistics
3.5.3 Energy & Utilities
3.5.4 Manufacturing
3.5.5 Government & Public Sector

3.6 Global Aerial Equipment Market Size and Share Outlook By End User, 2024 - 2032
3.6.1 Rental Companies
3.6.2 Direct End-Users

3.7 Global Aerial Equipment Market Size and Share Outlook by Region, 2024 - 2032

4. Asia Pacific Aerial Equipment Market Value, Market Share and Forecast to 2032
4.1 Asia Pacific Aerial Equipment Market Overview, 2024
4.2 Asia Pacific Aerial Equipment Market Revenue and Forecast, 2024 - 2032 (US$ Million)
4.3 Asia Pacific Aerial Equipment Market Size and Share Outlook By Product Type, 2024 - 2032
4.4 Asia Pacific Aerial Equipment Market Size and Share Outlook By Power Source, 2024 - 2032
4.5 Asia Pacific Aerial Equipment Market Size and Share Outlook By Application, 2024 - 2032
4.6 Asia Pacific Aerial Equipment Market Size and Share Outlook By End User, 2024 - 2032
4.7 Asia Pacific Aerial Equipment Market Size and Share Outlook by Country, 2024 - 2032
4.8 Key Companies in Asia Pacific Aerial Equipment Market

5. Europe Aerial Equipment Market Value, Market Share, and Forecast to 2032
5.1 Europe Aerial Equipment Market Overview, 2024
5.2 Europe Aerial Equipment Market Revenue and Forecast, 2024 - 2032 (US$ Million)
5.3 Europe Aerial Equipment Market Size and Share Outlook By Product Type, 2024 - 2032
5.4 Europe Aerial Equipment Market Size and Share Outlook By Power Source, 2024 - 2032
5.5 Europe Aerial Equipment Market Size and Share Outlook By Application, 2024 - 2032
5.6 Europe Aerial Equipment Market Size and Share Outlook By End User, 2024 - 2032
5.7 Europe Aerial Equipment Market Size and Share Outlook by Country, 2024 - 2032
5.8 Key Companies in Europe Aerial Equipment Market

6. North America Aerial Equipment Market Value, Market Share and Forecast to 2032
6.1 North America Aerial Equipment Market Overview, 2024
6.2 North America Aerial Equipment Market Revenue and Forecast, 2024 - 2032 (US$ Million)
6.3 North America Aerial Equipment Market Size and Share Outlook By Product Type, 2024 - 2032
6.4 North America Aerial Equipment Market Size and Share Outlook By Power Source, 2024 - 2032
6.5 North America Aerial Equipment Market Size and Share Outlook By Application, 2024 - 2032
6.6 North America Aerial Equipment Market Size and Share Outlook By End User, 2024 - 2032
6.7 North America Aerial Equipment Market Size and Share Outlook by Country, 2024 - 2032
6.8 Key Companies in North America Aerial Equipment Market

7. South and Central America Aerial Equipment Market Value, Market Share and Forecast to 2032
7.1 South and Central America Aerial Equipment Market Overview, 2024
7.2 South and Central America Aerial Equipment Market Revenue and Forecast, 2024 - 2032 (US$ Million)
7.3 South and Central America Aerial Equipment Market Size and Share Outlook By Product Type, 2024 - 2032
7.4 South and Central America Aerial Equipment Market Size and Share Outlook By Power Source, 2024 - 2032
7.5 South and Central America Aerial Equipment Market Size and Share Outlook By Application, 2024 - 2032
7.6 South and Central America Aerial Equipment Market Size and Share Outlook By End User, 2024 - 2032
7.7 South and Central America Aerial Equipment Market Size and Share Outlook by Country, 2024 - 2032
7.8 Key Companies in South and Central America Aerial Equipment Market

8. Middle East Africa Aerial Equipment Market Value, Market Share and Forecast to 2032
8.1 Middle East Africa Aerial Equipment Market Overview, 2024
8.2 Middle East and Africa Aerial Equipment Market Revenue and Forecast, 2024 - 2032 (US$ Million)
8.3 Middle East Africa Aerial Equipment Market Size and Share Outlook By Product Type, 2024 - 2032
8.4 Middle East Africa Aerial Equipment Market Size and Share Outlook By Power Source, 2024 - 2032
8.5 Middle East Africa Aerial Equipment Market Size and Share Outlook By Application, 2024 - 2032
8.6 Middle East Africa Aerial Equipment Market Size and Share Outlook By End User, 2024 - 2032
8.7 Middle East Africa Aerial Equipment Market Size and Share Outlook by Country, 2024 - 2032
8.8 Key Companies in Middle East Africa Aerial Equipment Market

9. Aerial Equipment Market Structure
9.1 Key Players
9.2 Aerial Equipment Companies - Key Strategies and Financial Analysis
9.2.1 Snapshot
9.2.3 Business Description
9.2.4 Products and Services
9.2.5 Financial Analysis

10. Aerial Equipment Industry Recent Developments

11 Appendix
11.1 Publisher Expertise
11.2 Research Methodology
11.3 Annual Subscription Plans
11.4 Contact Information


Get Free Sample

At OG Analysis, we understand the importance of informed decision-making in today's dynamic business landscape. To help you experience the depth and quality of our market research reports, we offer complimentary samples tailored to your specific needs.

Start Now! Please fill the form below for your free sample.

Why Request a Free Sample?

Evaluate Our Expertise: Our reports are crafted by industry experts and seasoned analysts. Requesting a sample allows you to assess the depth of research and the caliber of insights we provide.

Tailored to Your Needs: Let us know your industry, market segment, or specific topic of interest. Our free samples are customized to ensure relevance to your business objectives.

Witness Actionable Insights: See firsthand how our reports go beyond data, offering actionable insights and strategic recommendations that can drive your business forward.

Embark on your journey towards strategic decision-making by requesting a free sample from OG Analysis. Experience the caliber of insights that can transform the way you approach your business challenges.

You can purchase individual sections of this report. Explore pricing options for specific sections.

FAQ's

The Global Aerial Equipment Market is estimated to generate USD 15.07 Billion revenue in 2025.

The Global Aerial Equipment Market is expected to grow at a Compound Annual Growth Rate (CAGR) of 11.3% during the forecast period from 2025 to 2032.

By 2032, the Aerial Equipment Market is estimated to account for USD 31.88 Billion.

License

Didn’t find what you’re looking for? TALK TO OUR ANALYST TEAM

Need something within your budget? NO WORRIES! WE GOT YOU COVERED!

Related Products

Advanced Protective Gear And Armor Market Analysis and Outlook Report: Industry Size, Share, Growth Trends, and Forecast (2025-2032)

The global advanced protective gear and armor market is witnessing significant growth driven by rising security threats, increasing military modernization programs, and growing demand for protective solutions across defense, law enforcement, industrial, and civilian sectors. Advanced protective gear and armor include body armor, helmets, protective clothing, and ballistic-resistant equipment designed to provide enhanced protection against bullets, shrapnel, chemical agents, biological hazards, fire, and extreme environmental conditions. Defense forces worldwide are prioritizing the procurement of lightweight, high-strength armor systems that offer superior protection without compromising mobility and operational effectiveness. Additionally, the increasing frequency of military operations, peacekeeping missions, and counter-terrorism initiatives is driving the demand for advanced protective solutions to safeguard personnel in diverse combat and tactical environments. The market is further supported by technological advancements in materials science, such as the development of aramid fibers, ultra-high-molecular-weight polyethylene (UHMWPE), ceramic composites, and nanotechnology-based coatings that enhance the durability, strength-to-weight ratio, and multi-threat protection capabilities of gear and armor systems. North America holds the largest market share owing to extensive defense budgets, continuous upgrades in soldier protection systems, and strong homeland security investments. Meanwhile, Asia Pacific is emerging as the fastest-growing region due to rising defense spending, border security concerns, and increasing procurement of advanced armor solutions in countries such as China, India, Japan, and South Korea. However, high production costs, stringent regulatory testing standards, and weight optimization challenges for multi-functional protection remain key market constraints. Leading companies are focusing on R&D to develop ergonomic, scalable, and integrated protective solutions for military, industrial, and emergency response applications globally. Overall, the advanced protective gear and armor market is expected to maintain steady growth as safety, survivability, and mission effectiveness remain top priorities across defense and critical infrastructure sectors worldwide.Body armor is the largest product type segment in the advanced protective gear and armor market due to its extensive use among military personnel, law enforcement, and security forces globally. Its critical role in providing ballistic protection against bullets and shrapnel, combined with continuous advancements in lightweight and multi-threat resistant designs, drives its dominant market share in defense and security applications. Aramid fibers are the largest material type segment as they offer high strength-to-weight ratios, excellent thermal stability, and superior impact resistance, making them ideal for manufacturing body armor, helmets, and protective clothing. Their widespread adoption in military and industrial protective solutions supports their market leadership over other material categories.Key Insights The advanced protective gear and armor market is driven by increasing military modernization programs and rising geopolitical tensions worldwide. Defense forces are prioritizing procurement of lightweight, high-strength protective solutions to ensure soldier safety and operational mobility during combat, peacekeeping, and counter-terrorism operations. Body armor and ballistic protection systems remain the largest product segment due to their extensive use among military personnel, law enforcement officers, and security forces. Continuous improvements in ballistic resistance, weight reduction, and ergonomics are supporting their adoption in both developed and emerging defense markets. North America dominates the global market owing to large defense budgets, regular troop deployment, and strong homeland security initiatives. The U.S. Department of Defense continues to invest in advanced soldier protection programs with enhanced survivability, multi-threat resistance, and integrated communication features. Asia Pacific is the fastest-growing regional market driven by increasing defense spending, border security requirements, and modernization programs in China, India, Japan, and South Korea. These countries are investing in advanced protective gear to enhance troop protection and maintain regional security resilience. Technological advancements in material science, such as aramid fibers, UHMWPE, ceramic composites, and nanotechnology-based coatings, are improving the strength-to-weight ratio, thermal resistance, and multi-functional protection capabilities of protective gear and armor systems globally. Integration of sensors and smart technologies in protective gear is emerging as a key trend, enabling real-time health monitoring, environmental sensing, and threat detection for soldiers and first responders, thereby enhancing operational effectiveness and safety outcomes in critical missions. The industrial segment is also witnessing steady demand for protective clothing and gear in hazardous work environments such as mining, oil and gas, chemical processing, and firefighting. Regulatory standards mandating workplace safety are driving investments in certified protective equipment for worker safety assurance. High production costs and stringent testing and certification standards remain market challenges, especially for multi-functional armor solutions. Companies are focusing on cost optimization and design innovations to improve affordability while ensuring compliance with national and international protection standards. Leading players including 3M, Honeywell, DuPont, BAE Systems, Point Blank Enterprises, and ArmorSource are investing in R&D to develop scalable, ergonomic, and integrated protective solutions tailored for military, industrial, and emergency response applications worldwide. The market outlook remains positive as safety, survivability, and mission readiness continue to drive demand for advanced protective gear and armor. Defense and industrial sectors globally are expected to maintain stable procurement pipelines supported by continuous material innovation and safety regulations. Reort Scope Parameter Detail Base Year 2024 Estimated Year 2025 Forecast Period 2026-2034 Market Size-Units USD billion Market Splits Covered By Product Type, By Material type By End User Countries Covered North America (USA, Canada, Mexico) Europe (Germany, UK, France, Spain, Italy, Rest of Europe) Asia-Pacific (China, India, Japan, Australia, Rest of APAC) The Middle East and Africa (Middle East, Africa) South and Central America (Brazil, Argentina, Rest of SCA) Analysis Covered Latest Trends, Driving Factors, Challenges, Supply-Chain Analysis, Competitive Landscape, Company Strategies Customization 10 % free customization (up to 10 analyst hours) to modify segments, geographies, and companies analyzed Post-Sale Support 4 analyst hours, available up to 4 weeks Delivery Format The Latest Updated PDF and Excel Datafile

Published:Mar-2025

Airport Robots Market Analysis and Outlook Report: Industry Size, Share, Growth Trends, and Forecast (2025-2034)

The Airport Robots Market is rapidly expanding as airports worldwide adopt robotics to enhance efficiency, safety, and passenger experience. Robots are now deployed across diverse functions such as passenger guidance, baggage handling, security patrols, floor cleaning, and equipment inspection. These robotic solutions help airports manage growing passenger volumes, reduce labor overhead, and maintain consistent service levels. Recent technology advances—particularly in AI-powered navigation, computer vision, and sensor integration—enable robots to operate autonomously in complex airport environments, avoiding obstacles and interacting with travelers in real time. Market momentum is further driven by rising demand for contactless services and operational resilience, especially post-pandemic. Deployments like Dublin Airport's luggage-transporting robots for passengers with reduced mobility illustrate how robotics can support accessibility and enhance passenger satisfaction. Collaborative development between robotics vendors, airports, and airlines is leading to multifunctional service robots—ranging from baggage delivery bots to autonomous cleaning machines and cobots that assist staff. Forecasts indicate a robust annual growth of 13–17% with market size expected to exceed $1–1.5 billion in 2025, and rise to $4–5 billion by the mid-2030s, underscoring the strategic role of robots in shaping future airport operations. Key Insights_ Airport Robots Market Passenger guidance robots, equipped with touchscreens and dynamic routing, help travelers navigate terminals efficiently—especially those with reduced mobility—improving wayfinding and autonomy . Baggage-handling autonomous bots reduce physical strain on staff by transporting luggage from terminals to aircraft, improving throughput and operational resilience in peak periods. Security patrol robots, outfitted with cameras and sensors, conduct routine surveillance to supplement human personnel, helping to detect unattended items and monitor restricted zones efficiently . Cleaning and disinfection robots use UV-C or misting systems to sanitize floors and surfaces—critical for hygiene protocols and minimizing contagion risk in high-traffic zones. Collaborative cobots assist with repetitive tasks like trolley collection and conveyer loading, reducing manual workload and enhancing staff safety alongside real-time human oversight . AI-driven navigation systems using LiDAR and computer vision enable obstacle avoidance and smooth integration with passenger flows—even in congested areas. Swappable payload platforms allow a single robot chassis to perform multiple tasks—like guiding, cleaning, or delivering—offering cost-efficient versatility across airport operations. Regulatory frameworks and operator certification are evolving to accommodate safety standards for mixed human-robot environments, supporting broader adoption in public facilities. Strategic trials, such as Panasonic’s autonomous signage robot “Hospi” demonstrated at Narita Airport, highlight ongoing innovation in informational and hospitality-oriented robot deployment. Cloud-enabled fleet management systems allow centralized monitoring of operational metrics—like battery levels, mission progress, and maintenance alerts—helping airports optimize performance and readiness. Report Scope Parameter Detail Base Year 2024 Estimated Year 2025 Forecast Period 2026-2032 Market Size-Units USD billion Market Splits Covered By Type, By Application, By End User Countries Covered North America (USA, Canada, Mexico) Europe (Germany, UK, France, Spain, Italy, Rest of Europe) Asia-Pacific (China, India, Japan, Australia, Rest of APAC) The Middle East and Africa (Middle East, Africa) South and Central America (Brazil, Argentina, Rest of SCA) Analysis Covered Latest Trends, Driving Factors, Challenges, Trade Analysis, Price Analysis, Supply-Chain Analysis, Competitive Landscape, Company Strategies Customization 10% free customization (up to 10 analyst hours) to modify segments, geographies, and companies analyzed Post-Sale Support 4 analyst hours, available up to 4 weeks Delivery Format The Latest Updated PDF and Excel Datafile

Published:May-2025

Laser Communication Systems Market Outlook Report: Industry Size, Latest Trends and Growth Outlook

Laser Communication Systems Market Report Description The Laser Communication Systems market is emerging as a transformative segment within the broader telecommunications and aerospace industries. Laser communication systems utilize optical signals for transmitting data, offering significant advantages over traditional radio frequency (RF) communication methods. These systems are capable of delivering high-speed data transfer rates, enhanced security, and reduced latency, making them ideal for applications in space communication, military operations, and terrestrial networks. The increasing demand for high-bandwidth communication solutions, driven by the proliferation of data-intensive applications and the need for secure communication channels, is propelling the growth of the laser communication systems market. Furthermore, advancements in laser technology and photonics are facilitating the development of compact, efficient, and cost-effective laser communication devices. This comprehensive market research report delves into the current state of the laser communication systems market, examining key trends, drivers, challenges, and the competitive landscape to provide a detailed perspective on future growth prospects. Latest Trends One of the prominent trends in the laser communication systems market is the increasing deployment of satellite-based laser communication networks. These networks, often referred to as optical satellite communication, enable high-speed data transfer between satellites and ground stations, significantly enhancing the efficiency and capacity of global communication infrastructures. Another significant trend is the integration of laser communication systems in unmanned aerial vehicles (UAVs) and drones. This integration facilitates secure and high-bandwidth communication for military and commercial applications, such as surveillance, reconnaissance, and remote sensing. Additionally, the development of hybrid communication systems that combine laser and RF technologies is gaining traction. These systems leverage the strengths of both communication methods, ensuring reliable and versatile data transmission even in challenging environments. The increasing focus on miniaturization and the development of portable laser communication devices are also noteworthy trends, enabling more flexible and diverse applications across various sectors. Drivers The growth of the laser communication systems market is driven by several key factors. The escalating demand for high-speed and secure communication solutions, particularly in the defense and aerospace sectors, is a major driver. Laser communication systems offer enhanced data transfer rates and secure communication channels, making them ideal for sensitive military operations and satellite communications. In the commercial sector, the rising adoption of laser communication for high-frequency trading, telecommunication networks, and data center connectivity is fueling market growth. Government initiatives and funding for space exploration and satellite communication projects are also significant drivers. For instance, the increasing number of satellite launches and the growing focus on establishing global broadband networks via satellite constellations are boosting the demand for laser communication systems. Technological advancements in photonics and optoelectronics, leading to the development of more efficient and cost-effective laser communication devices, are further propelling market growth. Market Challenges Despite its promising growth prospects, the laser communication systems market faces several challenges. One of the primary challenges is the high initial cost of laser communication equipment and infrastructure. The deployment of these systems requires significant investment, which can be a barrier for smaller companies and emerging markets. Another challenge is the susceptibility of laser communication systems to environmental factors such as atmospheric turbulence, weather conditions, and line-of-sight obstructions. These factors can impact the reliability and performance of laser communication links, especially in terrestrial applications. Additionally, the integration of laser communication systems with existing RF-based communication infrastructures poses technical challenges. Ensuring compatibility and seamless operation between different communication technologies requires advanced engineering and substantial R&D efforts. Furthermore, regulatory and licensing issues related to the deployment of laser communication systems, particularly in space and military applications, can pose challenges to market growth. Major Players in the Laser Communication Systems Market 1. Thales Group 2. L3Harris Technologies 3. Mynaric AG 4. General Atomics 5. Ball Aerospace & Technologies Corp. 6. SpaceX 7. Boeing Defense, Space & Security 8. Airborne Wireless Network 9. BridgeComm Inc. 10. Laser Light Communications 11. ATLAS Space Operations 12. ViaSat Inc. 13. Xenesis Inc. 14. Hensoldt AG 15. Tesat-Spacecom GmbH & Co. KGMarket Scope Parameter Detail Base Year 2024 Estimated Year 2025 Forecast Period 2026-2032 Market Size-Units USD billion Market Splits Covered By Product Type, By Application, By Distribution Channel Countries Covered North America (USA, Canada, Mexico) Europe (Germany, UK, France, Spain, Italy, Rest of Europe) Asia-Pacific (China, India, Japan, Australia, Rest of APAC) The Middle East and Africa (Middle East, Africa) South and Central America (Brazil, Argentina, Rest of SCA) Analysis Covered Latest Trends, Driving Factors, Challenges, Trade Analysis, Price Analysis, Supply-Chain Analysis, Competitive Landscape, Company Strategies Customization 10% free customization (up to 10 analyst hours) to modify segments, geographies, and companies analyzed Post-Sale Support 4 analyst hours, available up to 4 weeks Delivery Format The Latest Updated PDF and Excel Datafile "

Published:Feb-2025