Surfactants Market Analysis and Outlook Report: Industry Size, Share, Growth Trends, and Forecast (2025-2032)

Published On: Feb, 2025
|
Pages: 153

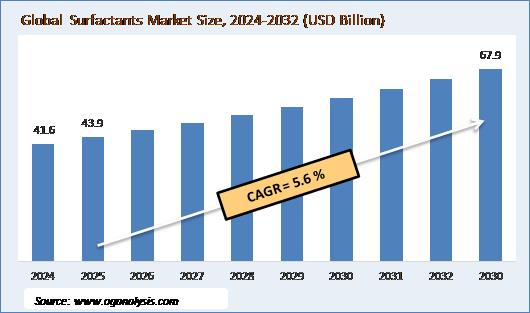
"The Global Surfactants Market is valued at USD 41.6 billion in 2024. Worldwide sales of Surfactants Market are expected to grow at a significant CAGR of 5.6%, reaching USD 64.33 billion by the end of the forecast period in 2032."

              Global  Surfactants Market Size, 2024-2032 (USD Billion) , Forecast

Surfactants Market Introduction and Overview

The surfactants market is a dynamic and ever-evolving sector that plays a pivotal role in numerous industries. Surfactants, or surface-active agents, are chemical compounds that reduce surface tension between liquids, solids, and gases. These versatile substances are widely used in industries such as personal care, detergents, agrochemicals, oil and gas, and industrial applications. The growing demand for household and industrial cleaning products, coupled with the expanding application of surfactants in cosmetic formulations, has significantly boosted market growth. In recent years, surfactants have also found their place in the food and beverage, textile, and pharmaceutical industries, further contributing to the market's expansion. Increasing urbanization, a growing consumer base, and shifting consumer preferences towards eco-friendly and sustainable products have provided additional momentum to the surfactants market. Manufacturers are increasingly focusing on innovation and the development of bio-based, biodegradable surfactants to cater to these changing demands, while also addressing environmental concerns associated with traditional surfactants.

The surfactants market is segmented based on product types such as anionic, cationic, non-ionic, and amphoteric surfactants. Among these, anionic surfactants are the most widely used due to their superior cleaning properties and cost-effectiveness. Non-ionic surfactants are also gaining popularity due to their mildness and reduced toxicity, making them ideal for personal care and cosmetics applications. Cationic surfactants, known for their anti-static and antimicrobial properties, find applications in fabric softeners, hair conditioners, and other specialty products. The market's growth is also driven by technological advancements that improve the performance and functionality of surfactants, alongside stringent environmental regulations that promote the shift to more sustainable alternatives. The rise of green chemistry has propelled the demand for surfactants derived from renewable sources, offering eco-friendly options that are biodegradable and have lower toxicity levels. This trend is expected to continue gaining traction as businesses and consumers alike become more conscious of the environmental impact of their purchasing choices, creating new opportunities for market players to innovate and expand their product portfolios.

Trade Intelligence for Surfactants Market

Global Surface-active preparations Trade, Imports, USD million, 2020-24


2020

2021

2022

2023

2024

 World

                    17,563

                    18,139

                      1,153

                        622

                       187

 Guatemala

                      48.34

                     56.22

                      80.30

                     99.06

                   104

 Trinidad and Tobago

                     20.60

                     18.72

                      23.63

                    19.44

                     20.83

 Guyana

                        6.75

                     11.20

                      11.41

                      13.35

                      12.92

 Barbados

                       7.65

                       7.63

                       9.02

                       8.92

                       9.25

 French Polynesia

                        9.27

                        8.19

                        9.71

                      8.32

                       5.67


Source: OGAnalysis

- Guatemala, Trinidad and Tobago, Guyana, Barbados and French Polynesia are the top five countries importing 81.5% of global Surface-active preparations in 2024
- Guatemala accounts for 55.6% of global Surface-active preparations trade in 2024
- Trinidad and Tobago accounts for 11.1% of global Surface-active preparations trade in 2024
- Guyana accounts for 6.9% of global Surface-active preparations trade in 2024

Global Surface-active preparations Export Prices, USD/Ton, 2020-24


Source: OGAnalysis

Latest Trends in the Surfactants Market

One of the prominent trends in the surfactants market is the increasing shift towards sustainable and eco-friendly surfactant products. Consumers and industries are becoming more environmentally conscious, prompting manufacturers to develop biodegradable and non-toxic alternatives. Bio-based surfactants, derived from renewable resources such as plant oils, sugars, and natural fats, are gaining significant traction. These products are not only sustainable but also perform well in terms of efficacy and safety. In addition to the environmental benefits, bio-based surfactants often meet the growing demand for "green" certifications in various industries such as cosmetics, personal care, and cleaning products. As sustainability becomes a key concern, manufacturers are investing in research and development (R&D) to create surfactants that are both functional and eco-friendly, catering to the evolving demands of the market.

Another key trend is the increasing use of surfactants in personal care and cosmetic formulations. Surfactants are essential in the formulation of a wide range of products such as shampoos, conditioners, body washes, and facial cleansers. With the rising consumer demand for high-quality personal care products, manufacturers are focusing on creating surfactants that offer enhanced skin compatibility, mildness, and improved sensory experiences. The growing trend towards "clean beauty" and the demand for products with fewer synthetic chemicals have driven the preference for surfactants derived from natural sources. Additionally, surfactants are being integrated into new product categories such as anti-aging creams, sunscreens, and other therapeutic skin treatments, further expanding their application range in the cosmetics sector.

Furthermore, the increasing demand for surfactants in the oil and gas industry is an emerging trend in the market. Surfactants play a crucial role in oil recovery, fracking fluids, and enhanced oil recovery (EOR) processes. They are used to reduce the surface tension between the oil and water, which improves the efficiency of extraction processes. As global energy demand rises, there is a greater focus on improving the efficiency of oil and gas extraction techniques, further driving the demand for surfactants. Additionally, surfactants are also employed in cleaning and maintenance activities within the oil and gas industry. The development of surfactants that can perform effectively in high temperatures and harsh conditions is a key area of innovation within this sector, as industries strive to enhance operational efficiency and reduce costs.

Market Drivers in the Surfactants Industry

The surfactants market is experiencing significant growth due to several key drivers. The rising demand for household and industrial cleaning products is a primary factor contributing to the market's expansion. Surfactants are integral components of detergents, surface cleaners, dishwashing liquids, and other cleaning formulations due to their ability to break down grease and remove dirt effectively. As urbanization increases, there is a greater need for cleaning products, especially in emerging economies where disposable incomes are rising, and there is a growing preference for convenience. Additionally, the expansion of industries such as automotive, textiles, and healthcare further fuels the demand for surfactants in cleaning and maintenance applications.

Another significant driver of the surfactants market is the growing demand for personal care and cosmetic products. With the increase in disposable income and changing lifestyles, consumers are becoming more inclined to purchase high-quality skincare, haircare, and beauty products. Surfactants, which are essential for emulsification, foaming, and cleansing in these products, are seeing increased demand. The desire for natural, organic, and sustainably sourced beauty products is also influencing market growth. Consumers are increasingly opting for cosmetics and personal care items that are free from harmful chemicals, driving the demand for mild and bio-based surfactants that meet these standards.

Technological advancements and innovations in surfactant production are further accelerating market growth. Manufacturers are adopting advanced technologies to improve the performance and functionality of surfactants, enhancing their applications in various industries. The growing adoption of green chemistry principles is encouraging the development of sustainable surfactants with lower environmental impact. This shift toward sustainability, combined with the demand for high-performance surfactants, is creating new opportunities for innovation. Furthermore, the rise in research and development activities aimed at improving surfactant formulations to meet the diverse needs of end-users is fostering the market’s evolution. Manufacturers are increasingly focused on creating multifunctional surfactants that cater to the varying demands of sectors like automotive, pharmaceuticals, and oil and gas.

Challenges in the Surfactants Market

Despite its growth potential, the surfactants market faces several challenges that could hinder its development. One of the main challenges is the volatility of raw material prices, particularly the costs associated with petrochemical-based feedstocks. The reliance on petroleum for the production of many conventional surfactants exposes manufacturers to price fluctuations in the global oil market. This unpredictability in raw material costs can create uncertainty for businesses and make it difficult to maintain consistent pricing for surfactants. Additionally, while the demand for bio-based surfactants is rising, the higher cost of production compared to traditional surfactants remains a challenge for manufacturers, limiting their widespread adoption in some industries.

Report Scope

Parameter

Surfactants Market scope Detail

Base Year

2024

Estimated Year

2025

Forecast Period

2026-2032

Market Size-Units

USD billion

Market Splits Covered

By Product Type, By Substrate, By Application,

Countries Covered

North America (USA, Canada, Mexico)
Europe (Germany, UK, France, Spain, Italy, Rest of Europe)
Asia-Pacific (China, India, Japan, Australia, Rest of APAC)
The Middle East and Africa (Middle East, Africa)
South and Central America (Brazil, Argentina, Rest of SCA)

Analysis Covered

Latest Trends, Driving Factors, Challenges, Trade Analysis, Price Analysis, Supply-Chain Analysis, Competitive Landscape, Company Strategies

Customization

10% free customization (up to 10 analyst hours) to modify segments, geographies, and companies analyzed

Post-Sale Support

4 analyst hours, available up to 4 weeks

Delivery Format

The Latest Updated PDF and Excel Data file

By Product Type

  • Anionic Surfactants
  • Amphoteric Surfactants
  • Cationic Surfactants
  • Non-Ionic Surfactants
  • Others

By Substrate

  • Bio-Based
  • Synthetic

By Application

  • Personal Care
  • Textiles
  • Industrial
  • Agriculture
  • Food and Beverage
  • Plastics and Adhesives
  • Others

Key Market Players Presented in the Report Include

BASF SE
Stepan Company
Evonik Industries AG
Dow Inc.
Nouryon
Solvay S.A.
Clariant AG
Kao Corporation
Croda International Plc
Indorama Ventures Public Company Limited
Galaxy Surfactants Limited
Oxiteno
SNF Floerger
Inolex
Windtree Therapeutics

Recent Developments 

  • Pilot Chemical partnered with Novvi LLC to exclusively introduce CalCare® AOS, a biobased alpha olefin sulfonate surfactant, for North American home, industrial, and personal care markets—leveraging renewable feedstock while maintaining high performance.
  • Pilot Chemical became the sole sulfonator and distributor of Novvi’s sustainable surfactant line, aiming to begin commercial-scale production at its Ohio facility in the coming months.
  • Pilot Chemical also partnered with Kao Corporation to bring Bio IOS®, another bio-based surfactant technology, to the North American market, strengthening its focus on eco-friendly offerings.

1. Table of Contents
1.1 List of Tables
1.2 List of Figures

2. Global Surfactants Market Review, 2024
2.1 Surfactants Industry Overview
2.2 Research Methodology

3. Surfactants Market Insights
3.1 Surfactants Market Trends to 2032
3.2 Future Opportunities in Surfactants Market
3.3 Dominant Applications of Surfactants, 2024 Vs 2032
3.4 Key Types of Surfactants, 2024 Vs 2032
3.5 Leading End Uses of Surfactants Market, 2024 Vs 2032
3.6 High Prospect Countries for Surfactants Market, 2024 Vs 2032

4. Surfactants Market Trends, Drivers, and Restraints
4.1 Latest Trends and Recent Developments in Surfactants Market
4.2 Key Factors Driving the Surfactants Market Growth
4.2 Major Challenges to the Surfactants industry, 2024- 2032
4.3 Impact of Wars and geo-political tensions on Surfactants supply chain

5 Five Forces Analysis for Global Surfactants Market
5.1 Surfactants Industry Attractiveness Index, 2024
5.2 Surfactants Market Threat of New Entrants
5.3 Surfactants Market Bargaining Power of Suppliers
5.4 Surfactants Market Bargaining Power of Buyers
5.5 Surfactants Market Intensity of Competitive Rivalry
5.6 Surfactants Market Threat of Substitutes

6. Global Surfactants Market Data – Industry Size, Share, and Outlook
6.1 Surfactants Market Annual Sales Outlook, 2024- 2032 ($ Million)
6.1 Global Surfactants Market Annual Sales Outlook by Type, 2024- 2032 ($ Million)
6.2 Global Surfactants Market Annual Sales Outlook by Application, 2024- 2032 ($ Million)
6.3 Global Surfactants Market Annual Sales Outlook by End-User, 2024- 2032 ($ Million)
6.4 Global Surfactants Market Annual Sales Outlook by Region, 2024- 2032 ($ Million)

7. Asia Pacific Surfactants Industry Statistics – Market Size, Share, Competition and Outlook
7.1 Asia Pacific Market Insights, 2024
7.2 Asia Pacific Surfactants Market Revenue Forecast by Type, 2024- 2032 (USD Million)
7.3 Asia Pacific Surfactants Market Revenue Forecast by Application, 2024- 2032(USD Million)
7.4 Asia Pacific Surfactants Market Revenue Forecast by End-User, 2024- 2032 (USD Million)
7.5 Asia Pacific Surfactants Market Revenue Forecast by Country, 2024- 2032 (USD Million)
7.5.1 China Surfactants Analysis and Forecast to 2032
7.5.2 Japan Surfactants Analysis and Forecast to 2032
7.5.3 India Surfactants Analysis and Forecast to 2032
7.5.4 South Korea Surfactants Analysis and Forecast to 2032
7.5.5 Australia Surfactants Analysis and Forecast to 2032
7.5.6 Indonesia Surfactants Analysis and Forecast to 2032
7.5.7 Malaysia Surfactants Analysis and Forecast to 2032
7.5.8 Vietnam Surfactants Analysis and Forecast to 2032

7.6 Leading Companies in Asia Pacific Surfactants Industry

8. Europe Surfactants Market Historical Trends, Outlook, and Business Prospects
8.1 Europe Key Findings, 2024
8.2 Europe Surfactants Market Size and Percentage Breakdown by Type, 2024- 2032 (USD Million)
8.3 Europe Surfactants Market Size and Percentage Breakdown by Application, 2024- 2032 (USD Million)
8.4 Europe Surfactants Market Size and Percentage Breakdown by End-User, 2024- 2032 (USD Million)
8.5 Europe Surfactants Market Size and Percentage Breakdown by Country, 2024- 2032 (USD Million)
8.5.1 2024 Germany Surfactants Market Size and Outlook to 2032
8.5.2 2024 United Kingdom Surfactants Market Size and Outlook to 2032
8.5.3 2024 France Surfactants Market Size and Outlook to 2032
8.5.4 2024 Italy Surfactants Market Size and Outlook to 2032
8.5.5 2024 Spain Surfactants Market Size and Outlook to 2032
8.5.6 2024 BeNeLux Surfactants Market Size and Outlook to 2032
8.5.7 2024 Russia Surfactants Market Size and Outlook to 2032

8.6 Leading Companies in Europe Surfactants Industry

9. North America Surfactants Market Trends, Outlook, and Growth Prospects
9.1 North America Snapshot, 2024
9.2 North America Surfactants Market Analysis and Outlook by Type, 2024- 2032($ Million)
9.3 North America Surfactants Market Analysis and Outlook by Application, 2024- 2032($ Million)
9.4 North America Surfactants Market Analysis and Outlook by End-User, 2024- 2032($ Million)
9.5 North America Surfactants Market Analysis and Outlook by Country, 2024- 2032($ Million)
9.5.1 United States Surfactants Market Analysis and Outlook
9.5.2 Canada Surfactants Market Analysis and Outlook
9.5.3 Mexico Surfactants Market Analysis and Outlook
9.6 Leading Companies in North America Surfactants Business

10. Latin America Surfactants Market Drivers, Challenges, and Growth Prospects
10.1 Latin America Snapshot, 2024
10.2 Latin America Surfactants Market Future by Type, 2024- 2032($ Million)
10.3 Latin America Surfactants Market Future by Application, 2024- 2032($ Million)
10.4 Latin America Surfactants Market Future by End-User, 2024- 2032($ Million)
10.5 Latin America Surfactants Market Future by Country, 2024- 2032($ Million)
10.5.1 Brazil Surfactants Market Analysis and Outlook to 2032
10.5.2 Argentina Surfactants Market Analysis and Outlook to 2032
10.5.3 Chile Surfactants Market Analysis and Outlook to 2032

10.6 Leading Companies in Latin America Surfactants Industry

11. Middle East Africa Surfactants Market Outlook and Growth Prospects
11.1 Middle East Africa Overview, 2024
11.2 Middle East Africa Surfactants Market Statistics by Type, 2024- 2032 (USD Million)
11.3 Middle East Africa Surfactants Market Statistics by Application, 2024- 2032 (USD Million)
11.4 Middle East Africa Surfactants Market Statistics by End-User, 2024- 2032 (USD Million)
11.5 Middle East Africa Surfactants Market Statistics by Country, 2024- 2032 (USD Million)
11.5.1 South Africa Surfactants Market Outlook
11.5.2 Egypt Surfactants Market Outlook
11.5.3 Saudi Arabia Surfactants Market Outlook
11.5.4 Iran Surfactants Market Outlook
11.5.5 UAE Surfactants Market Outlook

11.6 Leading Companies in Middle East Africa Surfactants Business

12. Surfactants Market Structure and Competitive Landscape
12.1 Key Companies in Surfactants Business
12.2 Surfactants Key Player Benchmarking
12.3 Surfactants Product Portfolio
12.4 Financial Analysis
12.5 SWOT and Financial Analysis Review

14. Latest News, Deals, and Developments in Surfactants Market
14.1 Surfactants trade export, import value and price analysis

15 Appendix
15.1 Publisher Expertise
15.2 Surfactants Industry Report Sources and Methodology


Get Free Sample

At OG Analysis, we understand the importance of informed decision-making in today's dynamic business landscape. To help you experience the depth and quality of our market research reports, we offer complimentary samples tailored to your specific needs.

Start Now! Please fill the form below for your free sample.

Why Request a Free Sample?

Evaluate Our Expertise: Our reports are crafted by industry experts and seasoned analysts. Requesting a sample allows you to assess the depth of research and the caliber of insights we provide.

Tailored to Your Needs: Let us know your industry, market segment, or specific topic of interest. Our free samples are customized to ensure relevance to your business objectives.

Witness Actionable Insights: See firsthand how our reports go beyond data, offering actionable insights and strategic recommendations that can drive your business forward.

Embark on your journey towards strategic decision-making by requesting a free sample from OG Analysis. Experience the caliber of insights that can transform the way you approach your business challenges.

You can purchase individual sections of this report. Explore pricing options for specific sections.

FAQ's

The Global Surfactants Market is estimated to generate USD 41.6 Billion in revenue in 2024.

The Global Surfactants Market is expected to grow at a Compound Annual Growth Rate (CAGR) of 5.6% during the forecast period from 2025 to 2032.

The Surfactants Market is estimated to reach USD 64.33 Billion by 2032.

License

$3950- 30%

$6450- 40%

$8450- 50%

$2850- 20%

Didn’t find what you’re looking for? TALK TO OUR ANALYST TEAM

Need something within your budget? NO WORRIES! WE GOT YOU COVERED!

Related Products

Ground Calcium Carbonate Market Outlook Report

Ground Calcium Carbonate Market Overview Ground calcium carbonate commonly referred to as GCC is finely ground limestone or marble, a calcium carbonate material having the chemical formula, CaCO3. GCC accounts for more than 80% of the Calcium carbonate market that is available in Ground Calcium Carbonate (GCC) and Precipitated Calcium Carbonate (PCC) forms. GCC is produced by mechanical grinding of the raw material, limestone, and then classified to the desired size without involving any chemical change in the process. In a magnified view, the distribution of particle sizes in a GCC is much broader than for a PCC of the same size, implying that there are many more large particles and many more small particles than in a PCC. The size of the largest of the particles (the ""top size"") is much greater for a GCC than for a PCC, thus making GCC a less refined version of Calcium carbonate. GCC is widely used as an industrial mineral is differentiated by three primary attributes - particle size, color and chemical purity. The mineral finds application in various industries based on its quality and suitability of use. Trade Intelligence forGround Calcium Carbonate Market Global Calcium carbonate Trade, Imports, USD million, 2020-24 2020 2021 2022 2023 2024 World 917 1,067 1,141 964 922 Germany 95.7 103 89.6 73.6 67.3 India 79.9 141 164 68.9 63.7 Saudi Arabia 33.8 37.9 35.8 29.5 39.2 Indonesia 31.5 37.9 44.1 40.5 38.4 United States of America 28.0 29.7 47.3 35.9 35.7 Source: OGAnalysis, International Trade Centre (ITC) - Germany, India, Saudi Arabia, Indonesia and United States of America are the top five countries importing 26.5% of global Calcium carbonate in 2024 - Global Calcium carbonate Imports increased by 0.5% between 2020 and 2024 - Germany accounts for 7.3% of global Calcium carbonate trade in 2024 - India accounts for 6.9% of global Calcium carbonate trade in 2024 - Saudi Arabia accounts for 4.3% of global Calcium carbonate trade in 2024 Global Calcium carbonate Export Prices, USD/Ton, 2020-24 Source: OGAnalysis Latest Trends in Ground Calcium Carbonate Market Growing Usage of Calcium Carbonate as Industrial Filler: Industrial filler has been the top and continuously growing application for calcium carbonate. Finely ground calcium carbonate is used as a filler in plastics, paints, and paper to improve aesthetics, and functionality and to save on filling costs. Calcium carbonate consumption as the filler has the potential to exceed calcium carbonate used as a dimension stone, in a few key markets. The most abundant sources of carbonate mineral fillers are the reserves of white marble. The most important attributes of carbonate fillers that decide their usefulness in industrial applications are particle size, brightness (whiteness), and chemical purity. Fillers were earlier used to substitute costlier materials in paint or polymers in rubbers or plastics. Currently, they are being used to add stiffness, color, opacity, or other required qualities to a product. Innovative technologies allowing the usage of GCC in new applications without altering the originality and functionality are aiding further penetration of GCC. Driving Factors Increase in Demand from the Construction and Infrastructure Sector: Robust development in construction and infrastructure activities across the world is generating demand for paints, coatings, adhesives, ceramics and various other polymers and concretes. These end-users are further deriving demand for ground calcium carbonate materials. Increasing Population, growing urbanization and fast-developing economies, especially in Asia and the Middle East, have led to growth in the need for infrastructure. Huge developments in infra projects and high-rise apartments necessitate lightweight and cost-effective options. Ground Calcium Carbonate is evolving robustly to match those requirements precisely. Market Challenges Environmental hazards of limestone mining: Limestone mining can disturb groundwater conditions. Limestone deposits frequently arise in association with karst, a landscape where limestone gradually dissolves underground. The deposits result in caves, sinkholes, and areas of rock ruptures that create underground drainage areas. Mining in karst can disturb natural aquifers and alter the flow of the underground water. Excavating operations often remove ground water to expose the mining site; this can decrease the level of the water table and alter water flows through rock formations. Streams and rivers can be changed when mines pump excess water from a limestone quarry into natural downstream channels. This increases the danger of flooding and any pollutants or alterations in water quality disturb the surface water. Report Scope Parameter Ground Calcium Carbonate market scope Detail Base Year 2024 Estimated Year 2025 Forecast Period 2026-2032 Market Size-Units USD million Market Splits Covered By form, By End-User Countries Covered North America (USA, Canada, Mexico) Europe (Germany, UK, France, Spain, Italy, Rest of Europe) Asia-Pacific (China, India, Japan, Australia, Rest of APAC) The Middle East and Africa (Middle East, Africa) South and Central America (Brazil, Argentina, Rest of SCA) Analysis Covered Latest Trends, Driving Factors, Challenges, Trade Analysis, Price Analysis, Supply-Chain Analysis, Competitive Landscape, Company Strategies Customization 10% free customization (up to 10 analyst hours) to modify segments, geographies, and companies analyzed Post-Sale Support 4 analyst hours, available up to 4 weeks Delivery Format The Latest Updated PDF and Excel Data file

Published:Feb-2025

TPU Filament Market Analysis and Outlook Report: Industry Size, Share, Growth Trends, and Forecast (2025-2034)

The TPU Filament Market is rapidly evolving as additive manufacturing gains widespread traction across sectors such as automotive, healthcare, sportswear, electronics, and industrial design. Thermoplastic polyurethane (TPU) filament is particularly prized for its flexibility, durability, and resistance to abrasion, making it an ideal choice for printing parts that require elasticity and mechanical performance. From wearable components and protective gear to seals, gaskets, and functional prototypes, TPU is becoming a go-to material in FDM (Fused Deposition Modeling) 3D printing. As the demand for customizable, on-demand, and lightweight components grows, industries are increasingly turning to TPU filament for producing complex geometries with enhanced tactile properties and chemical resistance, while also benefiting from shorter production lead times. Advancements in extrusion technology and material formulation are significantly enhancing the printability and consistency of TPU filaments. Key players are investing in R&D to develop high-flow variants, antimicrobial properties, and filaments with optimized surface finish and shore hardness. Asia-Pacific is emerging as a production and consumption hub due to its expanding electronics and automotive base, while North America and Europe remain strongholds of innovation and early adoption. Market competitiveness is intensifying with a mix of specialized filament producers and global polymer giants offering tailored grades of TPU to meet application-specific needs. Custom color matching, low-odor processing, and bio-based TPU innovations are also shaping strategic differentiation among manufacturers. Trade Intelligence-TPU Filament Market Global monofilaments, rods, sticks & profiles (>1 mm, excl. ethylene/vinyl chloride) , Imports, USD million, 2020-24 2020 2021 2022 2023 2024 World 2,126 2,646 2,802 2,627 2,639 United States of America 205 245 270 241 234 Germany 177 221 245 224 204 United Kingdom 93 84 127 113 125 France 114 148 168 147 123 Poland 91 116 124 108 118 Source: OGAnalysis, International Trade Centre (ITC) - United States of America , Germany , United Kingdom , France and Poland are the top five countries importing 30.5% of global monofilaments, rods, sticks & profiles (>1 mm, excl. ethylene/vinyl chloride) in 2024 - Global monofilaments, rods, sticks & profiles (>1 mm, excl. ethylene/vinyl chloride) Imports increased by 24.1% between 2020 and 2024 - United States of America accounts for 8.9% of global monofilaments, rods, sticks & profiles (>1 mm, excl. ethylene/vinyl chloride) trade in 2024 - Germany accounts for 7.7% of global monofilaments, rods, sticks & profiles (>1 mm, excl. ethylene/vinyl chloride) trade in 2024 - United Kingdom accounts for 4.7% of global monofilaments, rods, sticks & profiles (>1 mm, excl. ethylene/vinyl chloride) trade in 2024 Global monofilaments, rods, sticks & profiles (>1 mm, excl. ethylene/vinyl chloride) Export Prices, USD/Ton, 2020-24 Source: OGAnalysis, International Trade Centre (ITC) Key Takeaways – TPU Filament Market TPU filaments are increasingly used in consumer electronics, sportswear, and medical device prototyping due to their flexibility and strength. Rising adoption of desktop 3D printing in SMEs and educational institutions is contributing to the growing demand for easy-to-use TPU filament. Improved printability with dual extrusion compatibility and lower warping issues is broadening the user base for TPU filaments. Manufacturers are developing TPU filaments with enhanced chemical resistance for industrial applications like sealing, gasketing, and cable sheathing. Increased focus on sustainability is driving R&D in recyclable and bio-based TPU filament options for eco-conscious users. Asia-Pacific leads in manufacturing growth due to its cost-efficient production base and expanding end-use sectors. North America remains a top region for innovation, particularly in advanced medical devices, prosthetics, and sports gear using TPU filament. Limited compatibility of some TPU grades with entry-level 3D printers remains a challenge for widespread adoption in hobbyist markets. Price sensitivity and availability of low-cost alternatives can impact premium TPU filament adoption in cost-focused markets. Strategic alliances between filament manufacturers and 3D printer companies are helping standardize material-printer compatibility. Online distribution channels and DTC (direct-to-consumer) models are reshaping the filament supply landscape, offering more customization options. Demand for TPU filament with antibacterial and flame-retardant properties is rising in healthcare and industrial applications. Color variety, matte finish options, and flexible shore hardness grades are becoming key differentiators in a competitive landscape. Growth in e-commerce and DIY printing is supporting demand for packaged TPU filaments designed for user convenience and easy storage. Supply chain disruptions and fluctuations in TPU resin prices occasionally affect lead times and pricing consistency for filament manufacturers. Report Scope Parameter TPU Filament Market scope Detail Base Year 2024 Estimated Year 2025 Forecast Period 2026-2032 Market Size-Units USD billion Market Splits Covered By Product Type, By Application, By End User, By Technology, and By Distribution Channel Countries Covered North America (USA, Canada, Mexico) Europe (Germany, UK, France, Spain, Italy, Rest of Europe) Asia-Pacific (China, India, Japan, Australia, Rest of APAC) The Middle East and Africa (Middle East, Africa) South and Central America (Brazil, Argentina, Rest of SCA) Analysis Covered Latest Trends, Driving Factors, Challenges, Trade Analysis, Price Analysis, Supply-Chain Analysis, Competitive Landscape, Company Strategies Customization 10% free customization (up to 10 analyst hours) to modify segments, geographies, and companies analyzed Post-Sale Support 4 analyst hours, available up to 4 weeks Delivery Format The Latest Updated PDF and Excel Data file

Published:May-2025

HVAF Coating Materials Market Analysis and Outlook Report: Industry Size, Share, Growth Trends, and Forecast (2025-2034)

High Velocity Air Fuel (HVAF) coating materials are emerging as a preferred solution in industries requiring durable surface treatments for critical components. These materials are applied using HVAF thermal spray technology, which combines high particle velocity with lower flame temperatures, resulting in dense, hard coatings with minimal oxidation. Commonly used in aerospace, oil & gas, energy, and manufacturing, HVAF coatings extend component life, reduce downtime, and offer exceptional corrosion and wear resistance. Key materials include tungsten carbide, chromium carbide, and various metal alloys, each selected based on the application’s environmental demands. The growing focus on improving operational efficiency and reducing maintenance costs in high-value equipment is driving the adoption of HVAF coating systems. With regulatory pressure increasing on sustainability and lifecycle performance, HVAF coatings are positioned as an environmentally responsible alternative to hard chrome and other toxic legacy coatings. In 2024, the HVAF coating materials market saw increased traction across aerospace and power generation sectors. OEMs and MRO providers expanded the use of HVAF coatings for turbine blades, landing gear components, and pump housings due to their excellent adhesion, thermal resistance, and wear properties. Companies introduced new hybrid HVAF-HVOF systems to offer greater flexibility in coating operations. Additionally, material suppliers focused on developing finer carbide powders and custom alloy blends to meet application-specific demands. Environmental compliance also took center stage as more end-users moved away from hard chrome due to REACH regulations in Europe and similar policies in North America. Contract coating service providers upgraded their HVAF spray booths with automation and real-time quality monitoring to improve throughput and consistency. Several collaborative R&D projects between coating equipment manufacturers and academic institutions also resulted in prototype materials with improved microstructure and bond strength. Looking ahead to 2025 and beyond, the HVAF coating materials market is expected to evolve further with advancements in process control, material customization, and digital integration. AI and machine learning will play a greater role in optimizing spray parameters, predicting coating performance, and enabling closed-loop process adjustments. The expansion of hydrogen and renewable energy sectors will boost demand for high-durability coatings to protect components operating under extreme thermal and corrosive conditions. Additive manufacturing and component repair will open new frontiers for HVAF-compatible coatings that can be applied to complex geometries with minimal heat impact. Emerging economies in Asia and Latin America are likely to invest in HVAF coating capabilities as they scale up industrial production and seek to reduce imports of wear-prone components. Furthermore, sustainability goals will push manufacturers to develop coatings that are recyclable or have lower embedded carbon, reinforcing HVAF's role in next-generation surface engineering strategies. Trade Intelligence Ofhvaf coating materials market Global Other carbides (excl. Ca, Si, inorganic salts), Imports, USD million, 2020-24 2020 2021 2022 2023 2024 World 565 915 1036 841 831 United States of America 102 159 203 156 149 Germany 97 140 139 122 123 Japan 70 132 146 116 105 Sweden 56 106 116 86 93 Korea, Republic of 42 78 79 71 77 Source: OGAnalysis, (ITC) - United States of America, Germany, Japan, Sweden and Korea, Republic of are the top five countries importing 65.9% of global Other carbides (excl. Ca, Si, inorganic salts) in 2024 - Global Other carbides (excl. Ca, Si, inorganic salts) Imports increased by 46.9% between 2020 and 2024 - United States of America accounts for 18% of global Other carbides (excl. Ca, Si, inorganic salts) trade in 2024 - Germany accounts for 14.8% of global Other carbides (excl. Ca, Si, inorganic salts) trade in 2024 - Japan accounts for 12.6% of global Other carbides (excl. Ca, Si, inorganic salts) trade in 2024 Global Other carbides (excl. Ca, Si, inorganic salts) Export Prices, USD/Ton, 2020-24 Source: OGAnalysis Key Market Trends, Drivers and Challenges Hybrid thermal spray technologies combining HVAF and HVOF capabilities are becoming popular for enabling coating versatility, especially in aerospace and heavy machinery sectors where different surface properties are required across a single component. Increased adoption of eco-friendly HVAF coatings to replace hard chrome and cadmium plating due to environmental and worker safety regulations, particularly in Europe and North America, is driving material innovation and demand. Customization of feedstock materials is on the rise, with powder manufacturers offering fine-grained carbides and tailored alloy compositions optimized for specific performance targets such as high temperature oxidation resistance and extreme abrasion. Growing need for wear and corrosion-resistant coatings in high-performance sectors like oil & gas, marine, and energy, where downtime costs are significant and reliability is paramount, is pushing demand for advanced HVAF materials. Stringent global regulations (e.g., REACH, OSHA) banning or restricting toxic surface treatments are forcing manufacturers to adopt safer alternatives, making HVAF coatings a compliance-friendly replacement with comparable or superior performance. Technological advancements in spray systems and coating robots that support precise, repeatable HVAF application are reducing operational complexity and enabling wider adoption across industrial manufacturing and repair shops. High initial capital investment for HVAF systems and the need for skilled operators can limit adoption, especially among small-to-mid-sized enterprises in emerging markets or low-margin manufacturing sectors. Limited standardization in HVAF feedstock powders and process parameters across different suppliers can create inconsistency in coating quality and hinder scalability in global supply chains. Report Scope Parameter hvaf coating materials Market scope Detail Base Year 2024 Estimated Year 2025 Forecast Period 2026-2032 Market Size-Units USD billion Market Splits Covered By Product, By Application, By End User and By Technology Countries Covered North America (USA, Canada, Mexico) Europe (Germany, UK, France, Spain, Italy, Rest of Europe) Asia-Pacific (China, India, Japan, Australia, Rest of APAC) The Middle East and Africa (Middle East, Africa) South and Central America (Brazil, Argentina, Rest of SCA) Analysis Covered Latest Trends, Driving Factors, Challenges, Trade Analysis, Price Analysis, Supply-Chain Analysis, Competitive Landscape, Company Strategies Customization 10% free customization (up to 10 analyst hours) to modify segments, geographies, and companies analyzed Post-Sale Support 4 analyst hours, available up to 4 weeks Delivery Format The Latest Updated PDF and Excel Data file

Published:Jun-2025